balance analysis
Related publications
There are various methods for analyzing financial statements; the choice of the right one depends on the specific tasks set for yourself and the required amount of information. Vertical and horizontal balance sheet analysis are two commonly used methods. Horizontal and vertical analysis are used by many companies to analyze financial statements and increase company income and maintain a stable position of the enterprise. Also, these analysis methods are used by investors, banks and other lenders to reduce financing risks.
What tasks are solved using a three-year report?
A certain standard when drawing up reporting form No. 1 was the presentation of information in it for the current and previous periods. What is the reason for expanding the boundaries of data comparison to 3 years?
Financial statements, including the balance sheet, are the main source of information on the basis of which the current state of the company is assessed and future actions in various directions are planned. In order to better understand the economic trends emerging in an organization, there is a need to compare numerical values over a larger period of time, and 3 years is the most acceptable period for analysis.
The main problem in drawing up a balance sheet for 3 years is ensuring uniformity in the assessment of assets and liabilities. If during the period under study there were no significant changes in the laws and accounting policies of the company, then there will be almost no difficulties with the formation of a balance sheet and analysis. If legal acts and accounting rules in the organization have changed, adjustments to the figures are inevitable.
Vertical balance analysis
Vertical analysis of the balance sheet is also called structural, as it shows the structure of the final data of the balance sheet in the form of relative values. In a vertical analysis, reporting items are given as a percentage of its total. This type of analysis allows you to see changes in balance sheet items, for example, what happened to the company’s working capital, accounts receivable, and payables compared to previous years. Percentage indicators clearly show how much deviations have occurred and in what direction; this method is more convenient for analysis, since when calculating in absolute values it is not always clear how much the situation has worsened or improved.
In vertical analysis, the total amount of assets (if the balance sheet is analyzed) and revenue (when analyzing the financial position) is taken as one hundred percent, and each further item is presented as a percentage of the base value. The percentage is calculated by dividing each line for the analyzed year by the balance sheet currency and multiplying by 100%. For example, working capital as of 01/01/2015 is 450,110, divide this amount by the balance sheet currency 775,600 and multiply by 100%. The indicator as of 01/01/2015 is 58.03% (450,110 / 775,600 *100). In the same way, we calculate the percentage as of 01/01/2016, which is equal to 63.28%. It turns out that current assets increased by 5.25% compared to last year.
Example of a vertical analysis of a balance sheet:
Formation of indicators for analyzing the organization’s balance sheet
The balance sheet is the main reporting document of any organization. The composition of its indicators may vary from company to company, but the analysis is based on general principles and methods.
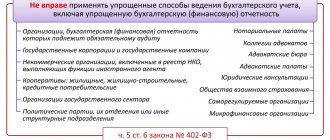
Analysis of the balance sheet is of practical importance if it is based on reliable information. To avoid its distortions (accidental or intentional), the enterprise must have an internal control system (Article 19 of the Law “On Accounting” dated December 6, 2011 No. 402-FZ). And to externally confirm the reliability of the balance sheet, an audit is used (clause 3 of the Law “On Auditing” dated December 30, 2008 No. 307-FZ). In some cases this is mandatory (Article 5 of Law No. 307-FZ). The list of companies subject to mandatory reporting audit can be found on the website of the Russian Ministry of Finance (https://www.minfin.ru/ru/perfomance/audit/basics/).
All mandatory accounting reports must meet the requirements for them: comparability, consistency, etc.
For more information about what requirements the balance sheet must meet, see the material “What requirements must accounting statements satisfy?” .
Let's consider the main stages of the analysis of the balance sheet.
Trend, factor and comparative analysis
In addition to the above stages of balance sheet analysis, trend, factor and comparative types of analysis can be carried out. They will complement and expand the volume of analytical data for making the necessary economic decisions.
Thanks to trend analysis, you can form an opinion about the main trend of changes in certain indicators (predictive analysis).
For example, a joint study of the dynamics of short-term debt and cash:
Balance indicator
As of 12/31/2016
As of 12/31/2017
As of 12/31/2018
Cash and cash equivalents
From the above figures it follows that, as of reporting dates, the nature of changes in the amount of short-term debts corresponds to changes in the volume of cash, but the company’s free cash is not enough to repay these debts.
Using factor analysis, the nature of the influence of the main factors on the change in the value of the indicator under study is determined. It is carried out according to a certain method of analyzing the balance sheet.
To carry out a comparative analysis, additional information is needed - the balance sheet data of one company is not enough. This is due to the fact that when carrying out this type of analysis, the balance sheet indicators of different companies are compared in order to determine their rating.
Specifics of analyzing the balance sheet of individual companies using the example of a bank balance sheet (Form 1)
Banks, although they are commercial companies and are created to make a profit, have specific features. They are subject to special legislation, maintain a special chart of accounts and build a different methodology for accounting processes.
At the same time, the main approaches to analyzing a bank’s balance sheet are in many ways similar to analyzing the balance sheet of an ordinary commercial company. For the bank balance sheet, the main stages of analysis also remain relevant:
- preliminary (reading the balance sheet, structuring its items, etc.),
- analytical (description of calculated indicators of structure, dynamics, relationship between balance sheet indicators);
- final (evaluation of analysis results).
In the process of analyzing the bank’s balance sheet, special coefficients are also calculated, but their types differ from those discussed earlier:
- bank reliability coefficient (capital adequacy ratio),
- return on assets ratio (shows the efficiency of using assets and quality based on their profitability),
- leverage ratio (interbank loans), etc.
To learn how banks analyze the creditworthiness of their clients, read the material “Methods for assessing the creditworthiness of commercial bank clients.”
Online program to facilitate the analysis process
Modern information processing tools can significantly simplify the process of comprehensive analysis of the balance sheet. Calculations are carried out both using standard computer programs (for example, using Excel, where you can carry out calculations, create tables and charts), and using specialized programs that allow you to conduct financial analysis online - via the Internet.
The use of specialized software not only saves time, but also significantly expands the types of analysis. They allow you to analyze market stability, business activity, score assessment of financial stability, etc. In addition, developers of specialized programs provide the possibility of adapting and changing the program depending on the goals and objectives of the analysis, taking into account the specifics of a particular enterprise.
Analysis of balance sheet indicators is a voluminous and multi-stage process. Its results make it possible to identify potential risks, develop the financial policy of the enterprise and contribute to effective management decisions. The analysis process can be facilitated by using specialized programs.
Six Steps to Analyzing a Balance Sheet
Balance sheet analysis can be carried out directly from the balance sheet or from an aggregated analytical balance sheet. Let's consider six stages of balance sheet analysis: analysis of the dynamics and structure of the balance sheet, analysis of the financial stability of the organization, analysis of the liquidity of the balance sheet and solvency of the enterprise, analysis of the state of assets, analysis of business activity and diagnostics of the financial condition of the enterprise.
Analysis of financial statements includes analysis of all its forms, including explanatory notes and the final part of the auditor's report.
During the preliminary analysis of financial statements, the dynamics of “sick” reporting items of two types are identified and assessed:
- indicating the extremely unsatisfactory performance of a commercial organization in the reporting period and the resulting poor financial position (uncovered losses, overdue loans and accounts payable, etc.);
- indicating certain shortcomings in the organization's work, which, if they are regularly repeated in the reporting of several adjacent periods, can significantly affect the financial position of the organization (overdue accounts receivable, debt written off to financial results, fines, penalties, penalties collected from the organization, negative net cash flow, etc.)
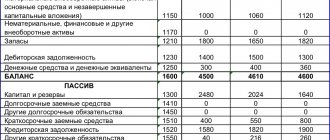
Balance sheet analysis can be carried out directly from the balance sheet or from the aggregated analytical balance sheet presented below. The items (lines) of the balance sheet that are recommended to be included in the selected groups of the analytical balance sheet are indicated in brackets.
Table 1. Aggregated analytical balance
Balance sheet: briefly about the main thing
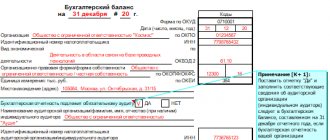
F. No. 1 is the main financial report on the current state of the company’s economic activities.
The balance sheet consists of two equal parts or sides: an asset and a liability. In turn, each part is structured and contains generalized indicators about property, valuables, reserves, liabilities, capital, reserves and others. Accounting data is presented over the past few years. That is, the financial report allows you to compare similar indicators in relation to the same period of previous years.
Unified form
In f. No. 1, you should enter accounting data generated as of the reporting date. If errors from previous years were identified during the reporting financial year, the information must be corrected. Information about discrepancies must be disclosed in detail in an explanatory note in the balance sheet.
Completed sample
IMPORTANT! Balance sheet indicators are the main criteria for verification by tax authorities. So, for example, if the company does not own fixed assets for carrying out its activities, but there is a profit, then such an entity will be checked by Federal Tax Service employees personally. This situation indicates fictitious activity and/or money laundering.
Horizontal and vertical balance analysis. How to calculate. Formulas
Maintaining accounting records is the most important aspect of the activities of a serious commercial organization. But the ability to analyze the balance sheet is also important, because the data recorded in it can tell an expert about the past and current activities of the company, as well as predict the development of the enterprise in the future. Depending on how much information the analyst needs and what specific goals he pursues, one of the many existing methods of balance sheet analysis is selected. But the most popular are horizontal and vertical balance sheet analysis, because... both methods allow:
- reduce the risks of creditors when investing in companies;
- develop methods to maintain production stability;
- increase the company's income;
- conduct a competent analysis of financial statements.
Important! Horizontal and vertical balance sheet analysis can be used simultaneously, since they complement each other and help conduct a more in-depth study of accounting data, which allows you to see the company’s growth rate and the dynamics of its development.
***
Compiling reports over 3 years makes them more informative for users, but it is necessary to adjust the figures to ensure their comparability.
Similar articles
- We draw up a balance sheet for an enterprise in the form of an LLC
- Explanatory note to the balance sheet 2018 sample
- Rules for filling out form No. 3 for the balance sheet
- Accounting calendar for 2021 - reporting
- Basic rules for evaluating balance sheet items
Brief information about the balance sheet
The balance sheet is a key type of reporting, thanks to which the company’s management has the opportunity to see the dynamics of the enterprise’s development in specific figures, the presence of short-term and long-term debts, the origin of funds, as well as the volume of fixed/working assets.
The balance sheet is often called a financial entity, due to the fact that the information contained in the statements clearly demonstrates to company managers and analysts the risks of ruin and development prospects, as well as the rate of growth (decline).
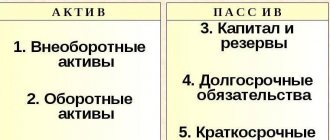
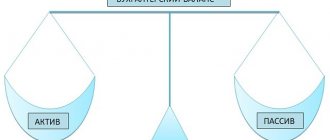
The results of the balance sheet are 2 parts, equal to each other (if the balance sheet is drawn up correctly):
- ASSETS (money, material assets, machinery, equipment, buildings and structures, inventories, debts of counterparties and consumers, etc.) - everything that a company owns and disposes of for the purpose of carrying out commercial activities and making a profit.
- LIABILITIES (short-term liabilities to counterparties and clients, borrowed funds, retained earnings, own (share) capital) - information about the sources of the company's assets.
Horizontal and vertical business analysis can help company management find weaknesses in the company’s activities and options for correcting errors.
Reporting period
There are two types of reporting:
- Annual reporting
- Interim reporting
Annual reporting is required; this data may be required by the Federal Tax Service and Rosstat. It is drawn up based on the results of the past year and implies the following reporting period: from January 1 to December 31. If the company has just been registered, the timing of the reporting period changes. If the company was opened before September 30, the reporting period will take less than a year (from the date of registration to the end of the current year), if after September 30 - more than a year (from the date of registration to the end of the next year).
If we talk about interim reporting, it can be prepared for a month or a quarter. Of course, such reporting should not exceed a period of more than one year.
Horizontal balance sheet analysis. Example with conclusions
The method of analysis that will be discussed is called horizontal for the reason that information for each item of the balance sheet for several periods is located in a row horizontally. The more periods of activity the data is compared, the more columns there are in the analysis table.
Below is a list of basic information you need to know about horizontal analysis of financial statements:
- This method is used in cases where it is necessary to study the time dynamics of balance sheet results.
- Not only the values of absolute indicators (in rubles), but also relative ones (in %) are subject to comparison:
- To conduct the analysis, you should select 2-3 quarters or years. Absolute (or relative) values are consistently compared with similar indicators of later periods.
- Horizontal analysis makes it possible to assess whether production indicators have improved or worsened in comparison with the year before and last year.
Bringing retrospective information into a comparable form
When compiling a balance sheet for three years , you may encounter a significant change in the procedure for accounting for property in the company in the last reporting period. In this situation, it will be necessary to reflect the data as if the latest changes were in effect throughout the period for which the report is being compiled. In this case, in the balance sheet for 3 years of LLC , JSC, PJSC, the amounts resulting from the recalculation must be entered in account 84 “Retained earnings (uncovered loss).”
In addition, an explanatory note must be drawn up, indicating in which data and for what reason the adjustments were made, and their amounts are deciphered. Small enterprises may not make such a recalculation based on clause 15.1 of PBU 1/2008.
Vertical balance sheet analysis (structural). Examples with conclusions
Basic information about vertical analysis of accounting data can be seen in the list below:
- Structural analysis is to demonstrate the structure of the final accounting information. reporting in the form of relative indicators expressed as percentages. As a result of the study, the expert receives the values of all balance sheet items as a percentage of its total.
- The advantage of vertical analysis over horizontal analysis is that in absolute terms it is difficult to see whether positive or negative dynamics are observed in the company’s work. Relative values, on the contrary, make it easy to assess whether financial indicators have deviated for the worse or for the better, and to what extent. The obtained output data in relative values will not allow for incorrect comparisons due to the influence of various external factors, such as the inflationary process.
- This method of analysis differs from horizontal analysis in that vertical analysis is focused on a selected moment and provides an assessment of the company’s position on the day the report is issued. The method is used when necessary:
- see how certain accounting items have changed in comparison with previous periods. balance;
- compare the capital structures of several companies or enterprises in different fields of activity;
- find out the composition of external and working capital;
- find out whether the size of the company's borrowed capital has decreased or increased;
- check how the structure of liabilities and assets has changed.
The essence of using structural balance sheet analysis is as follows:
- The total amount of revenue when analyzing the company's financial performance statement (form No. 2) is taken equal to 100%. If the balance sheet is examined, the total amount of assets is taken as 100%. Vertical analysis is also suitable for studying the statement of cash flows (form No. 4) and changes in capital (form No. 3).
- All balance sheet items are individually calculated as a percentage of 100% (i.e., the total amount of assets or revenue). To implement this, the analyst must select the period (year) of activity of the analyzed company, and then divide each individual balance sheet line by the accounting currency. balance, and then multiply the result by one hundred percent (since the value must be relative, in %).
Let's return to point 2 of the algorithm, which was given above the table. Let's find out how the values in the table were obtained using the example of current assets:
- For January 1, 2015:
- For January 1, 2021:
- Increase in assets in 2021 compared to last year:
Now that we understand how the data in the table was calculated, let's analyze it and draw conclusions:
- The amount of long-term debt of the analyzed company decreased slightly.
- The amount of equity (shareholder) capital is 50% of the total liabilities (this indicates that the company is characterized by an average level of stability).
- Short-term debt makes up a third of the balance sheet and remains virtually unchanged.
- The number of OS objects is reduced because some of them are going out of circulation.
- 63% of assets account for working capital, and the increase in their share was a consequence of the growth of accounts receivable (the company's management should think about the reasons for its growth).
Let's try to conduct a vertical analysis of data for 2 years of operation of the enterprise in absolute and relative values:
In general, the interpretation of a set of balance sheet output data is carried out by professional financial analysts and auditors, since it is necessary to be able to see the big picture and draw conclusions based on comprehensive research. What can be said unambiguously to a non-specialist, looking at the table we received, is that:
- the analyzed company has no changes in its own funds in the form of authorized capital, but the amount of available equity capital has increased by 8% due to the presence of retained earnings;
- the company has attracted a fairly large amount of borrowed funds, liabilities include >60% of accounts payable, but the positive side is a decrease in the level of loans in dynamics;
- the enterprise is solvent and quite stable financially, since there is a decent level of cash (48.22%);
- the company does not competently select counterparties for cooperation; most likely, the current partners are insolvent, because there is a high level of accounts receivable;
- the data from the table indicates that the level of accounts receivable and inventory of the company is high, and therefore there are fewer non-current assets than current assets (the bad thing is that there may be extra costs for storing inventory (logistics), but the good thing is that managers care about investing funds into uninterrupted production).
Financial reporting with a practical example
Financial statements are information about the financial position, results of operations and changes in the financial position of an individual entrepreneur or organization. An expert will help you compose it correctly and without errors.
The purpose of accounting and financial reporting is to provide stakeholders with complete and reliable information about the financial position, performance results and changes in the financial position of individual entrepreneurs (IP) and organizations.
The reporting period for annual financial statements is the calendar year from 1 January to 31 December. The first reporting year for a newly created organization begins from the moment of its state registration until December 31 of the same year.
The accounting and financial reporting system in the Republic of Kazakhstan is regulated by the Law of the Republic of Kazakhstan “On Accounting and Financial Reporting” dated February 28, 2007 No. 234-III (hereinafter referred to as the Law on Accounting).
The Accounting Law establishes the obligation of all individual entrepreneurs and legal entities to maintain accounting records and prepare financial statements, with the exception of individual entrepreneurs who simultaneously meet the following conditions:
1) apply, in accordance with the tax legislation of the Republic of Kazakhstan, special tax regimes based on a patent, simplified declaration;
2) are not registered for VAT;
3) are not subjects of natural monopolies.
In Kazakhstan, three standards have been approved regulating the rules for preparing financial statements that organizations must follow: the National Financial Reporting Standard (NFRS) or optionally: International Financial Reporting Standards (IFRS), International Financial Reporting Standards for Small and Medium Enterprises (IFRS for SMEs) ).
Financial reporting, with the exception of reporting by government agencies, includes:
1) balance sheet;
2) profit and loss statement;
3) cash flow statement;
4) statement of changes in capital;
5) explanatory note.
In order for financial statements to achieve their main purpose - to present information about the financial position, financial results and cash flows of the organization, they must be reliable.
In practice, the preparation of financial statements begins with checking the accounting balance sheet for the period. It is necessary to ensure that all balances in permanent accounts have no credit balances in active accounts and debit balances in passive accounts at the end of the accounting period. It is also necessary to check that transit accounts do not have a balance at the end of the reporting period and are transferred to permanent accounts.
Financial statements are prepared on the basis of the balance sheet. As a basis for the compliance of specific accounts with the articles “Balance Sheet” and “Profit and Loss Statement” (OPL), it is possible to take the explanations for filling out financial statements, approved by Order of the Minister of Finance of the Republic of Kazakhstan dated June 28, 2021 No. 404.
Example
LLP “A” is a small business entity and prepares financial statements in accordance with NSFR. Financial statements should be prepared.
LLP “A” balance sheet for 2018
tenge
We will draw up a balance sheet taking into account the correspondence of the balance sheet accounts to the lines of the financial statements.
Balance sheet of LLP “A” as of December 31, 2018
tenge
We prepare the profit and loss report in accordance with the transit accounts of the balance sheet and the lines of the financial statements.
Profit and loss report of LLP "A" for 2021
tenge
When drawing up a cash flow statement, it is necessary to check the consistency of the amounts on the lines:
– the amount in line 140 for the previous period in the cash flow statement must correspond to line 010 of the balance sheet at the beginning of the reporting period;
– the amount in line 150 for the reporting period in the cash flow statement must correspond to line 010 of the balance sheet at the end of the reporting period.
Cash flow statement of LLP "A" for 2021 (direct method)
tenge
To control the correctness of the preparation of the report on changes in capital, it is necessary to reconcile the amounts of authorized capital and retained earnings in the report and balance sheet at the beginning and end of the reporting period.
Report on changes in equity capital of LLP “A” for 2018
tenge
In order for the statements prepared in accordance with the requirements of the legislation of the Republic of Kazakhstan to comply with IFRS standards, it is necessary to make adjustments.
There are a huge number of possible adjustments related to the differences between the requirements of IFRS and the legislation of the Republic of Kazakhstan. Let's look at some of them:
The list and forms of annual financial statements for publication by public interest organizations are developed and approved by the authorized body (Order of the Minister of Finance of the Republic of Kazakhstan dated June 28, 2017 No. 404).
In accordance with paragraph 7 of Article 19 of the Accounting Law, public interest organizations are required to submit financial statements to the depository in the manner established by the Government of the Republic of Kazakhstan by August 31 of the year following the reporting year.
The volume, forms and procedure for preparing financial statements of state institutions, with the exception of the National Bank of the Republic of Kazakhstan, are established by the budget legislation of the Republic of Kazakhstan.
Answers to frequently asked questions on the topic “Horizontal and vertical balance sheet analysis”
Question: What are the advantages and disadvantages of using vertical and horizontal analysis of financial statements?
Answer: The positive side of horizontal analysis is the ability to assess the dynamics of financial indicators by year. A significant drawback is the fact that this type of analysis is of little use for assessing the financial condition and making decisions by managers - it is rather a diagnostic method. As for vertical analysis, it makes it possible to track changes in the structure of A and P of the company, but also does not allow assessing its financial condition.