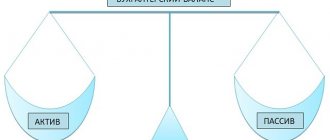
A balance sheet asset is a part of the balance sheet that contains data about the assets of the enterprise, that is, about its property.
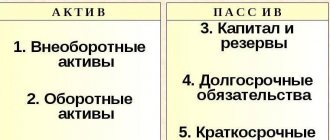
The balance sheet asset reflects property, property rights and funds, grouped into two sections:
- fixed assets;
- current assets.
Within these sections, assets are listed in order of increasing liquidity: the lower the value of an asset, the higher its liquidity.
The total of the “balance sheet asset” section is also called the balance sheet total or balance sheet currency.
Why does a director need to understand financial statements?
The manager is responsible for everything that happens in his company, including accounting. Although the chief accountant or another financial specialist prepares the reports, it is the director who certifies them. The current balance sheet form does not provide for a second signature at all.
Naturally, the manager must understand what he is signing and be able to identify dubious places in the report.
In addition, balance sheets of other organizations often end up on the director’s desk. The fact is that when signing an agreement with a new partner, businessmen usually request detailed information about him, which includes financial statements.
Of course, the counterparties' reports will first be analyzed by the company's financiers. But the last word on concluding a contract in any case remains with the director. He must weigh all the factors, including independently studying the reporting of a potential partner, without relying only on the opinion of his subordinates.
We will consider the analysis methodology using the example of simplified forms of financial statements.
The current form of the balance sheet shows data for three dates: the beginning and end of the reporting year, as well as the beginning of the previous year. Form No. 2 also includes two years of information. Therefore, you can see how the indicators change over time
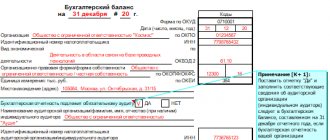
Balance sheet (form No. 1)
Financial results report (form No. 2)
Who needs to read the balance sheet and why?
A balance sheet is a basic accounting report that is only a few pages long.
There are no illustrations and little text; it is filled with many numbers. Nevertheless, the information hidden in the numbers brings a lot of benefits to those who know how to read it. This document is carefully studied by a huge number of people (managers and owners of companies, investors, bankers, tax authorities and other interested parties). The balance sheet is not a commercial secret, can be published in print for public viewing and is available to anyone.
You will find a line-by-line procedure for filling out a balance sheet with examples in the Guide from ConsultantPlus. If you do not already have access to this legal system, a full access trial is available for free.
Why read the balance sheet? The answer is obvious: to make the right financial decisions. And it doesn’t matter whether it is compiled in a traditional form or a simplified one - the usefulness of the information obtained from it does not decrease.
Read about who has the opportunity to prepare simplified reporting in this article.
Reading a balance sheet does not require higher financial education, but you cannot do without certain knowledge and techniques.
Balance sheet asset
Let's start looking at the balance sheet from the asset. This section reflects the company's resources that it can use to conduct business. Assets are arranged in descending order of liquidity, i.e. the ability to quickly implement them and receive money ( Latin liquidus - “flowing”).
Non-current assets or fixed assets (line 1150) - real estate, equipment, transport, etc.
If your company did not buy or sell fixed assets in the previous two years, then this figure will decrease slightly (on average by several percent per year) due to depreciation. This is the option discussed in the example.
If there were such purchases, then the indicator of non-current assets as of the last reporting date should be higher than for the previous ones.
If you are considering the balance sheet of a third-party company, then the presence of significant fixed assets is one of the indicators that indicates the reliability of a potential partner.
Of course, this does not mean that there is no need to work with counterparties whose indicators on line 1150 are small or zero. For example, many quite successful trading or transport companies actively use rented premises or cars.
Intangible assets (p. 1170) - patents, licenses, etc. They are also subject to depreciation and are reflected in the balance sheet according to the same rules as fixed assets. In our example, they are not present, because we are considering the balance sheet of a small enterprise, for which this type of asset is not very typical.
Inventories (p. 1210) include goods, finished goods, raw materials, and work in progress.
Their growth in dynamics should not exceed the growth rate of revenue, otherwise this indicates that the efficiency of using the company’s resources is decreasing.
To determine the average annual size of inventories, you need to add up the data at the beginning and end of the year and divide the amount by 2. The average annual indicators for other balance sheet items are determined in the same way.
Of course, to more accurately determine average annual figures, it is better to use the values at the beginning of each month. But now we are talking about analysis based on standard balance sheet data, and it does not contain monthly information.
Fixed assets
Non-current assets are assets (property) that are not consumed in the production process in one turnover or during the year. This includes the following assets:
| Line | Type of non-current assets |
| 1110 | Intangible assets |
| 1120 | Research and development results |
| 1130 | Intangible search assets |
| 1140 | Material prospecting assets |
| 1150 | Fixed assets |
| 1160 | Profitable investments in material assets |
| 1170 | Financial investments |
| 1180 | Deferred tax assets |
| 1190 | Other noncurrent assets |
Example
Z2018 = (1820 + 1650) / 2 = 1735 thousand rubles.
Z2019 = (1650 + 1800) / 2 = 1725 thousand rubles.
Z2019 / Z2018 = 1725 / 1735 = 99%
V2019 / V2018 = 28000 / 20000 = 140%
Revenue increased significantly, but inventories remained almost at the same level. This suggests that the company has begun to use them much more effectively.
Accounts receivable (p. 1230) are debts to the company. Primarily we are talking about buyers, but there may also be other types of debts, for example:
- suppliers for advances issued;
- budget for overpayment of taxes;
- personnel for accountable amounts.
The best thing is when the “receivables” decrease. If it grows, then the growth rate should be lower than that of revenue.
It is also desirable that accounts receivable do not exceed accounts payable (p. 1520).
Example
DZ2018 = (1300 + 1500) / 2 = 1400 thousand rubles.
DZ2019 = (1500 + 1400) / 2 = 1450 thousand rubles.
KZ2018 = (1900 + 260 + 1820 + 216) / 2 = 2098 thousand rubles.
KZ2019 = (1820 + 216 + 1580 + 40) / 2 = 1828 thousand rubles.
Accounts receivable is growing, but only slightly (1450 / 1400 - 1400 = 4%). This is much lower than the revenue growth rate (40%). In addition, it is significantly lower than accounts payable. This indicates that the company's debt management system is working effectively (provided that accounts payable are repaid without delay).
Cash (p. 1250) is a very fast-moving metric. Many companies almost completely spend all the money they receive, so the figure for this item may be small. But if an organization pays its obligations on time, then the minimum account balance at the end of the period does not indicate problems with the company’s finances.
Asset structure (share in the total balance sheet), in percent
Asset structure.
The assets of the enterprise are divided into 2 large groups:
- non-current assets (immobilized funds), the service life of which is more than 12 months;
- current assets (mobile assets), the service life of which does not exceed 12 months.
Non-current assets include: the cost of fixed assets, intangible assets; construction in progress, long-term financial investments, profitable investments in tangible assets, deferred tax and other non-current assets.
Fixed assets are acquired for long-term use by the enterprise.
Current (current) assets include: cash, securities, accounts receivable, inventories and expenses. These assets are current in the sense that they are in a constant cycle of turning them into cash and therefore play a large role in generating profit. Those current assets that can be easily converted into cash are marketable assets. These include, in addition to cash, securities and short-term receivables. Inventories are slow moving assets. Non-current assets and long-term receivables are classified as hard-to-sell assets.
The enterprise's funds can be used in internal circulation and beyond, being immobilized in profitable investments in material assets, accounts receivable, securities or invested in the turnover of other enterprises.
Analysis of the structure of assets - analysis of the size, structure and ratio of fixed and current assets of the enterprise and the dynamics of their elements. Analysis of the asset structure shows:
- The amount of current and permanent assets;
- Articles growing at a faster pace;
- The share of frozen assets in inventories and receivables.
| Balance sheet item | Line code | 2011 | 2012 | 2013 | Change in the share of the balance sheet, % |
| I. Non-current assets | |||||
| Intangible assets | 1110 | Line 1110 divided by line 1600 | Line 1110 divided by line 1600 | And so on | The value of the last year minus the value of the first year |
| Research and development results | 1120 | Line 1120 divided by line 1600 | And so on | ||
| Intangible search assets | 1130 | And so on | |||
| Material prospecting assets | 1140 | ||||
| Fixed assets | 1150 | ||||
| Profitable investments in material assets | 1160 | ||||
| Long-term financial investments | 1170 | ||||
| Deferred tax assets | 1180 | ||||
| Other noncurrent assets | 1190 | ||||
| Total for Section I | 1100 | ||||
| II. Current assets | |||||
| Reserves | 1210 | ||||
| Value added tax on purchased assets | 1220 | ||||
| Accounts receivable | 1230 | ||||
| Financial investments | 1240 | ||||
| Cash | 1250 | ||||
| Other current assets | 1260 | ||||
| Total for Section II | 1200 | ||||
| Balance | 1600 |
Calculation of the asset structure of an enterprise online for free
The financial analysis:
- I. NON-CURRENT ASSETS Non-current assets are property used in the activities of an enterprise for more than a year. Its value is transferred in parts to the cost of finished products. A sign of assets is the ability to generate income for the organization.…
- II. CURRENT ASSETS Current assets are property used in the activities of an enterprise for less than a year or used in one production cycle, which also does not exceed one year. Its entire cost...
- IV. LONG-TERM LIABILITIES Section IV. Long-term liabilities are the fourth section of the balance sheet. At the same time, it is also the second section of the liability side of the balance sheet, which shows the sources of financing for the property. AND…
- Balance sheet liability The balance sheet liability is the second part of the balance sheet. It contains a list of those financial resources that were used to acquire property, that is, assets that...
- Key performance indicators of an enterprise Key performance indicators of an enterprise are indicators that allow us to judge several things: The size of the enterprise and the scale of its activities The level of income and expenses About ...
- Absolute economic indicators of an enterprise's activity Absolute economic indicators of an enterprise's activity are indicators that allow us to judge several things: The size of the enterprise and the scale of its activities The level of income and expenses...
- Balance sheet asset A balance sheet asset is a part of the balance sheet containing data on the assets of the enterprise, that is, on its property. The balance sheet asset reflects property, property rights and cash...
- III. CAPITAL AND RESERVES Section III Capital and Reserves is the third section of the balance sheet. But what is more important is the first section of financial sources, that is, the liability side of the balance sheet. By this he...
- V. CURRENT LIABILITIES Section V. Current liabilities is the fifth section of the balance sheet. At the same time, it is also the third section of the liability side of the balance sheet, which shows the sources of financing for the property. AND…
- Relative economic indicators of the enterprise’s activity Relative indicators of the enterprise’s activity are indicators that allow one to judge the efficiency of work. The initial data for the preparation of such indicators can be taken from the balance sheet and report on ...
Liability balance
The liabilities side of the balance sheet lists the sources of funds from which the company finances its assets.
The article “Capital and reserves” (page 1300) for most LLCs consists of two parts:
- Authorized capital is the funds that the founders invested when creating the business. According to the law, for an LLC it must be no less than 10 thousand rubles, and for a public joint-stock company - no less than 100 thousand rubles. The larger the authorized capital, the more reliable the company is in the eyes of counterparties, banks, investors, etc.
- Retained earnings are that part of the company's profits that the founders decided to keep in circulation.
If the authorized capital did not change and the owners of the company did not receive dividends, then the difference between the indicators on line 1300 at the beginning and end of the year will be equal to the financial result. This is exactly the case considered in our example.
Change in capital for 2021 and 2021
K2018 = 2024 – 1640 = 384 thousand rubles.
K2019 = 2480 – 2024 = 456 thousand rubles.
These amounts are equal to the company's net profit on Form No. 2 for 2021 and 2019, respectively.
The item “Long-term borrowed funds” (p. 1410) includes all loans and borrowings received for a period of more than a year.
The article “Short-term borrowed funds” (p. 1510) combines “short-term” loans and borrowings, i.e. received for less than a year.
The mere presence of borrowed funds and an increase in their amount does not mean that the company has problems. However, if loan debts are growing, but revenue remains stagnant or even falls, then this should cause concern. Most likely, in this case, the bank’s money is not invested in development, but is used to “plug holes.”
In our example, revenue increases, but the amount of debt on loans decreases. This indicates the effective use of borrowed funds.
The item “Other long-term liabilities” (page 1450) also lists the company's debts that are due in more than a year. But here we are talking about all other similar debts (except for banks), for example, under long-term contracts with suppliers.
The items “Accounts payable” (p. 1520) and “Other short-term liabilities (p. 1550) include all “non-bank” debts of the organization with a short maturity.
This includes not only debts to counterparties, but also current debts on taxes, wages, accountable amounts, etc.
Short-term accounts payable must be no less than accounts receivable and must not grow at a faster rate than revenue. In our example, the “creditor” even decreases, but the revenue increases.
Current assets
Current assets are assets (property) that are consumed in the production process in one turnover or during the year. This includes the following assets:
| Line | Type of current assets |
| 1210 | Reserves |
| 1220 | Value added tax on purchased assets |
| 1230 | Accounts receivable |
| 1240 | Financial investments (excluding cash equivalents) |
| 1250 | Cash and cash equivalents |
| 1260 | Other current assets |
The total assets of the balance sheet (line 1600 of the balance sheet) must correspond to the total of the liabilities of the balance sheet (line 1700 of the balance sheet). That is, balance sheet equality must be satisfied (assets must be equal to liabilities).
This equality arises because the assets of the balance sheet show property. And in the liability side of the balance sheet are the finances with which it was purchased.
An analysis of the assets of the balance sheet in conjunction with an analysis of the liabilities of the balance sheet and the income statement can be carried out here: analysis of the financial condition of the enterprise.
Best regards, Alexander Krylov,
The financial analysis:
- I. NON-CURRENT ASSETS Non-current assets are property used in the activities of an enterprise for more than a year. Its value is transferred in parts to the cost of finished products. A sign of assets is the ability to generate income for the organization.…
- Balance sheet liability The balance sheet liability is the second part of the balance sheet. It contains a list of those financial resources that were used to acquire property, that is, assets that...
- III. CAPITAL AND RESERVES Section III Capital and Reserves is the third section of the balance sheet. But what is more important is the first section of financial sources, that is, the liability side of the balance sheet. By this he...
- II. CURRENT ASSETS Current assets are property used in the activities of an enterprise for less than a year or used in one production cycle, which also does not exceed one year. Its entire cost...
- Horizontal and vertical analysis of the balance sheet and income statement (profit and loss) Good afternoon, my dear reader. In this article we will consider such a topic as horizontal and vertical analysis of the balance sheet and financial results statement (income and...
- V. CURRENT LIABILITIES Section V. Current liabilities is the fifth section of the balance sheet. At the same time, it is also the third section of the liability side of the balance sheet, which shows the sources of financing for the property. AND…
- IV. LONG-TERM LIABILITIES Section IV. Long-term liabilities are the fourth section of the balance sheet. At the same time, it is also the second section of the liability side of the balance sheet, which shows the sources of financing for the property. AND…
- Absolute economic indicators of an enterprise's activity Absolute economic indicators of an enterprise's activity are indicators that allow us to judge several things: The size of the enterprise and the scale of its activities The level of income and expenses...
- Key performance indicators of an enterprise Key performance indicators of an enterprise are indicators that allow us to judge several things: The size of the enterprise and the scale of its activities The level of income and expenses About ...
- Analysis of the financial condition of the enterprise Hello. This page contains an updated service for free analysis of the financial condition of an enterprise online. In 2019-2020, some lines in the income statement changed, so...
Analysis of financial ratios
To draw conclusions about the financial position of a company, it is necessary not only to analyze absolute indicators, but also to calculate the relationships between them, i.e. – coefficients. They, like absolute numbers, also need to be studied over time in order to draw conclusions about business development trends. Let's consider the main financial indicators that can be obtained based on financial statements.
- Profitability is the ratio of net profit to revenue or assets. To calculate it, not only the balance sheet is used, but also another main accounting form - the income statement.
Return on sales:
Rp = PE / V
Return on assets:
Ra = PE / A
If a company operates successfully, then not only its revenue and net profit should grow, but also its profitability percentage.
What is included in the balance sheet of a company?
The balance sheet of an enterprise contains data on assets. Their list depends on the type of activity, but basically they are:
- cash;
- petty cash;
- accounts receivable;
- inventories;
- equipment;
- Earth;
- building;
- advance payments for goods;
- prepayment for insurance.
Information about assets reflects the financial position of the company, which is important for potential investors and banks to which the company applies for a loan.
The company also collects information about liabilities. It can be:
- accounts payable;
- wage arrears;
- tax debt;
- interest on loans;
- expenses payable;
- remuneration of temporary workers;
- leasing agreements for equipment.
The principal amount of loan payments is included in the company's balance sheet only for the reporting period, just like the amount of leasing payments.
There are also other assets and liabilities, depending on the type of activity of the organization. The balance sheet of a typical business will include almost all of these items. The balance sheet of a business is a reflection of the financial position of the company, so the store must keep records of all assets and liabilities.
Example
| Period | Revenue | Net profit | Return on sales |
| 2018 | 20000 | 384 | 1,9% |
| 2019 | 28000 | 456 | 1,6% |
| Period | Assets | Net profit | Return on assets |
| 2018 | 4605 | 384 | 8,3% |
| 2019 | 4555 | 456 | 10,0% |
The tables show that, although absolute profit has increased, the percentage of return on sales has decreased slightly. Company management needs to pay attention to the cost structure.
But the return on assets has increased significantly, i.e. The efficiency of using the company's resources as a whole is growing.
- Capital structure. It is characterized by the autonomy coefficient - the ratio of equity capital to assets.
KA = SK / A
In the simplified balance sheet structure, equity is line 1300 “Capital and reserves”. Assets are the result of the balance sheet, i.e. line value 1600.
Sometimes in the economic literature you can find an indication that the normative value of CA should not be lower than 0.5. Those. business owners must finance the company with at least half of their own funds.
However, this approach in many cases resembles measuring the “average temperature in a hospital.” Much depends on the specifics of the business, primarily on the field of activity.
If we are talking about a trading company, then KA may be lower, reaching 0.3. Such companies often rent premises and equipment, and take the goods for sale.
For complex high-tech industries the situation will be the opposite. The owners of such companies usually try to acquire ownership of equipment and production premises. Indeed, in such a situation, any problems with landlords and the need to move can paralyze the business for a long time.
But in any case, the CA should not be overestimated - up to 0.7 - 0.8 or more. This, of course, increases financial stability, but deprives the company of potential income from the use of borrowed funds.
How to draw up a balance sheet correctly
This report is compiled for a month, for a quarter, for a year.
Please note:
- When drawing up a balance sheet at the time of the reporting period before the tax period, be sure to carry out an inventory;
- If there is a discrepancy in any data when compiling a report, be sure to leave explanatory notes. And those numbers that do not add up, add them to the balance sheet to carry out the reformation.
When drawing up a balance sheet, you must rely on PBU 4/99. Also, according to the order of the Ministry of Finance dated July 22, 2003, all reports are compiled strictly in thousands or millions. The accounting policy of the enterprise must contain information about how numbers will be rounded.
In those lines in which nothing will fit, it is necessary to put dashes. The amount that is considered a loss is not written with a minus, it is simply written in brackets.
Please also note that the amounts available at the beginning of the period and at the end must necessarily converge. If at the time of drawing up the balance sheet there were changes in government policy, then make a report in accordance with the new rules, but be sure to leave explanatory notes.
Example
| date | Equity | Assets | CA |
| 31.12.2017 | 1640 | 4600 | 0,36 |
| 31.12.2018 | 2024 | 4610 | 0,44 |
| 31.12.2019 | 2480 | 4500 | 0,55 |
The table shows that CA is growing steadily and reaching the average standard value as of the last reporting date.
- Solvency. The main indicator that characterizes a company's ability to pay off its obligations is the total liquidity ratio. It is equal to the ratio of current assets to short-term liabilities
Klo = OA / KP
Current assets are the sum of inventories, accounts receivable and cash.
OA = page 1210 + page 1230 + page 1250
Short-term liabilities are the sum of all short-term debts of the enterprise.
KP = page 1510 + 1520 + page 1550
The Klo standard can vary from 1 to 2.5. Those. Even in the most extreme case, debts with short maturities should be fully covered by liquid assets.
And here, too, a lot depends on the direction of the company. Trading firms can allow a reduction in KLo to values slightly exceeding 1, because their inventory is usually easy to sell if necessary.
It is usually more difficult for manufacturing enterprises to sell stock balances in warehouses, therefore KLo for them should be higher, approximately in the range of 1.5 - 2.5. But there is no need to increase this coefficient too much either, because while resources are in reserves.
How to read a balance sheet
Currently watching: 1584
Every year, the company prepares annual final financial statements - a balance sheet and a profit and loss account. In this article we will look at how to read a balance sheet, but in this article, you can learn how to read an income statement.
BALANCE SHEET
The balance sheet contains information about the financial condition and performance of an enterprise at a certain point in time. From the balance sheet you can find out where the funds invested in a given business came from and where they were placed at the time the balance sheet was compiled.
The balance sheet reflects all transactions made in the course of the business activities of the enterprise, therefore, for its analysis, it is important to read the balance sheet correctly.
The balance sheet consists of two sections: assets and liabilities. They, in turn, are further divided into sections. Let's look at them.
ASSETS
Assets are all material resources that have monetary value and are at the disposal of the enterprise. Assets are divided into tangible and intangible assets.
Tangible assets are the property of an enterprise (for example, buildings, equipment, machinery, vehicles, raw materials).
Intangible assets are understood as ownership of any right (for example, a patent or the right to receive profits in the future).
All assets included in the balance sheet have a monetary value. However, important factors such as staff management ability, good industrial relations and morale cannot be included in the balance sheet.
The balance sheet asset includes the following sections:
Non-current assets have a fairly high cost and a long period of use by the enterprise (buildings, structures, land, machinery, equipment, vehicles, etc.).
Because the cost of non-current assets is very high, it is not deducted from profit in the year of acquisition, but is distributed over its expected life in the form of depreciation.
Current assets are cash and balance sheet items that can be quickly and easily converted into cash. Current assets are designed to serve the processes of production and circulation. That is, these are assets that can be quickly “turned” into money. Examples of current assets are finished goods inventories and accounts receivable (debt from customers to the company).
In addition, this section reflects items characterizing the amount of VAT on purchased assets.
LIABILITIES
Liabilities are the financial obligations of a company. They arise when using credits or loans. Depending on the maturity period, short-term and long-term liabilities are distinguished.
Current liabilities are accounts payable that are due within one year (trade creditors, bank overdraft).
Long-term liabilities are accounts payable that are due in more than one year. Long-term liabilities include: bank loans, unpaid lease amounts, etc.
The balance sheet liability consists of three sections:
“Capital and reserves” - reflects the composition and structure of equity capital, which includes sources of the organization’s financial resources that are different in their economic content, principles of formation and use: authorized capital, reserve and additional capital, special purpose funds, retained earnings of the reporting year, uncovered loss of previous years and reporting year.
“Long-term liabilities” - intended to reflect debt as of the reporting date on long-term bank loans and loans received from other organizations and institutions.
“Short-term liabilities” - contains information about the status of settlements on short-term bank loans and borrowings, as well as the presence of accounts payable and other short-term liabilities. This includes articles 98 “Deferred income” and 96 “Reserves for future expenses”.
SIGNS OF “GOOD” BALANCE
In general terms, signs of a “good” balance are:
- the balance sheet currency at the end of the reporting period should increase compared to the beginning of the period;
- the growth rate (in %) of current assets must be higher than the growth rate in percentage of non-current assets;
- the organization's own capital in absolute terms must exceed borrowed capital and (or) its growth rate in percentage must be higher than the growth rate of borrowed capital;
- the growth rates of accounts receivable and accounts payable should be approximately the same or accounts payable slightly higher;
- the share of own funds in current assets must be more than 10%;
- There should be no item “Uncovered loss” in the balance sheet, i.e. the figure on the balance line 470 should be without parentheses.
In order to learn how to analyze the financial condition of an enterprise, I suggest you take the online training course “Financial Analysis of an Enterprise.”
See you on the course!)
Example
| date | Current assets | Short-term liabilities | Klaw |
| 31.12.2017 | 3480 | 2960 | 1,18 |
| 31.12.2018 | 3550 | 2586 | 1,37 |
| 31.12.2019 | 3500 | 2020 | 1,73 |
CL is steadily increasing and reached 1.73 as of the last reporting date. This indicator allows you to ensure solvency for a company from any field of activity.
Accounting for beginners from postings to balance sheet: reading a balance sheet using an example
How to read a balance sheet using an example? Let's look at this using the data from the report of Prestige LLC.
| Indicator name | Line code | As of 12/31/2020 | As of 12/31/2019 | As of 12/31/2018 |
| I. NON-CURRENT ASSETS | ||||
| Fixed assets | 1150 | 750 | 779 | 810 |
| Financial investments | 1170 | 50 | – | – |
| II. CURRENT ASSETS | ||||
| Reserves | 1210 | 112 | 118 | 116 |
| Accounts receivable | 1230 | 56 | 49 | 51 |
| Cash and cash equivalents | 1250 | – | 10 | 12 |
| BALANCE | 1600 | 968 | 956 | 989 |
| III. CAPITAL AND RESERVES | ||||
| Authorized capital | 1310 | 10 | 10 | 10 |
| Reserve capital | 1360 | 4 | 3 | 2 |
| retained earnings | 1370 | 511 | 478 | 315 |
| V. SHORT-TERM LIABILITIES | ||||
| Accounts payable | 1520 | 443 | 465 | 662 |
| BALANCE | 1700 | 968 | 956 | 989 |
A fleeting glance at the balance sheet - and the first conclusions: the company does not apply PBU 18/02 - SHE and IT are absent from the balance sheet (perhaps the legal entity is related to a small business). The balance sheet currency has not changed sharply over the past 3 years (fluctuation 1–3%), no borrowed funds were attracted, profits grew steadily, which indicates the financial stability of the organization.