- September 2, 2019
- Accounting
- Anastasia Ivanova
This type of analysis is used by consulting firms to understand where conventional accounting has fallen short. It answers the questions: “What do you need to pay attention to?” and “How to restore the profitability of the company or individual divisions?”
Dividing costs into variable and fixed helps solve a number of management problems:
- Find out where the money is going.
- Distribute resources between products.
- Determine the required minimum production.
- Calculate the margin of financial strength for your company.
The concept of variable and fixed costs
In this article, the concepts of fixed and variable costs, expenses and costs will be used interchangeably, although some scholars do not share these terms.
Variable costs are those company expenses that decrease or increase with production volume. In other words, the more products a company produces, the higher its variable costs and vice versa. Examples of variable expenses include piecework wages for workers, materials for production, electricity for production equipment, and payment for transporting goods.
Fixed costs are those expenses that a firm must always pay, no matter how much output it produces. There are fixed costs even when products are not produced at all. These include management salaries, electricity for office premises, depreciation, rent, etc.
Enterprise costs: concept
Enterprise costs in the general sense of the word mean all the costs of a company associated with its functioning. Company expenses are classified according to various criteria. For example, a business might spend money on:
Take our proprietary course on choosing stocks on the stock market → training course
- acquisition of equipment, raw materials and supplies;
- production maintenance;
- payment of wages;
- maintenance of the administrative complex;
- economic needs, etc.
One of the characteristics of the classification of enterprise costs is the volume of production. In this case, costs are divided into variable, fixed and gross.
| Business valuation | Financial analysis according to IFRS | Financial analysis according to RAS |
| Calculation of NPV, IRR in Excel | Valuation of stocks and bonds |
Types of costs
In business it is very difficult to find “pure” variable and fixed expenses. This division is used to simplify the analysis. The types of variable and fixed costs in real life are semi-fixed and semi-variable costs.
Their peculiarity is that some of the costs are variable, and some are constant. An example is a worker’s wages, which consists of a salary and a bonus for each part made. The salary portion will be a fixed cost, and the additional payment for parts will be a variable cost.
Examples of fixed costs
Next, we will explain the content of the listed areas of fixed costs .
— Salaries of non-production personnel. This includes such divisions of the organization as accounting, legal department, technical group. support, security guards and other categories of personnel not directly involved in the production of goods and services, but ensuring the maintenance of all business processes of the enterprise.
- Payment of utility services. Part of utility payments will depend on production volumes, for example, related to the use of water for production purposes. But for any enterprise there is a certain minimum consumption of electricity, water supply, etc., which are necessary even if the company does not produce anything. First of all, this includes lighting of premises, water supply not intended for the manufacture of products, heating, etc.
— The organization’s security system includes cost items associated with the operation of video surveillance, alarm systems, etc.
— Development costs involve a wide range of work. This includes scientific and technical developments aimed at improving production processes, and the development of an advertising campaign and promotion strategy, and much more.
The composition of fixed expenses is not limited to this list. Everything will depend on the specifics of each specific enterprise. For example, in many cases this will also include write-offs of costs associated with depreciation of equipment.
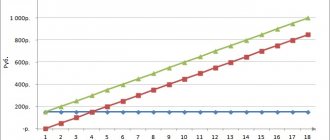
Graphical representation of variable and fixed costs
Variable costs appear as a straight line on a graph. The starting point is the origin because at zero production variable costs are zero. A graph is considered to be a linear function of the form:
- Y = k*x, where y is the value of variable costs in monetary terms, x is the quantity of products produced, k is the amount of variable costs per unit of production
The fixed cost graph is also straight, but not from the origin, but parallel to the horizontal axis. This is due to the already described features of fixed costs. The equation looks like:
- Y=k, where y, k is the value of fixed costs in monetary terms.
Accumulation and distribution of variable costs
When choosing simple direct costing, when calculating variable costs, only direct material costs are calculated and taken into account. They are collected from accounts 10, 15, 16 (depending on the adopted accounting policy and methodology for accounting for inventories) and written off to account 20 “Main production” (see Instructions for using the Chart of Accounts ).
The cost of work in progress and semi-finished products of own production is accounted for at variable costs. Moreover, complex raw materials, the processing of which produces a number of products, also refers to direct costs, although they cannot be directly correlated with any one product. To distribute the cost of such raw materials among products, the following methods are used:
- according to the calculated coefficients of direct attribution of raw material components to individual types of manufactured products;
- according to the conditional relationship between raw materials and product, expressed in physical form, for example, the produced weight ratio (determined by conditional coefficients);
- by eliminating costs. One of the resulting products is taken as the main one, and the rest are considered by-products, and their cost is subtracted from the total costs of the technological process according to the conventional measures adopted for them. The difference between the total cost and the cost of by-products represents in this case the cost of producing the main product[2];
- distribution of costs among simultaneously obtained products, reduced to a single measurement using conversion factors (the cost of useful substances found in raw materials is used).
The indicated distribution indicators are suitable not only for writing off costs for complex raw materials used for the manufacture of different types of products, but also for production and processing in which direct distribution of variable costs to the cost of individual products is impossible.
But it’s still easier to divide costs in proportion to sales prices or natural indicators of product output. The company is introducing simple direct costing in production, which results in the production of three types of products (No. 1, 2, 3). Variable costs - for basic and auxiliary materials, semi-finished products, as well as fuel and energy for technological purposes. In total, variable costs amounted to 500 thousand rubles. Product No. 1 produced 1 thousand units, the selling price of which was 200 thousand rubles, product No. 2 - 3 thousand units with a total selling price of 500 thousand rubles, product No. 3 - 2 thousand units with a total selling price of 300 thousand . rub.
Let's calculate the cost distribution coefficients in proportion to sales prices (thousand rubles) and the natural output indicator (thousand units). In particular, the first will be 20% (200 thousand rubles / ((200 + 500 + 300) thousand rubles)) for product No. 1, 50% (500 thousand rubles / ((200 + 500 + 300) thousand rubles)) for products No. 2, 30% (500 thousand rubles / ((200 + 500 + 300) thousand rubles)) for products No. 3. The second coefficient will take the following values: 17% (1 thousand units / ((1 + 3 + 2) thousand units)) for product No. 1, 50% (3 thousand units / ((1+3+2) thousand units)) for product No. 2 , 33% (2 thousand units / ((1 + 3 + 2) thousand units)) for product No. 2.
In the table we will distribute variable costs according to two options:
| Name | Types of cost distribution, thousand rubles. | |
| By product release | At selling prices | |
| Product No. 1 | 85 (500 x 17%) | 100 (500 x 20%) |
| Product No. 2 | 250 (500 x 50%) | 250 (500 x 50%) |
| Product No. 3 | 165 (500 x 33%) | 150 (500 x 30%) |
| Total amount | 500 | 500 |
Options for the distribution of variable costs are different, and more objective, in the author’s opinion, is assignment to one or another group based on quantitative output.
Analysis time interval
As the company develops and turnover increases, for example, when acquiring additional capacity or hiring new managers, fixed costs change. On the graph it looks like steps.
The division into variable and fixed costs can only be made in the short term. The fact is that in the long term, turnover grows, payments, rental prices and utility bills increase under the influence of inflation and other external factors. As a result, all company expenses become variable.
CVP analysis
The “Cost – Volume – Profit” analysis is used to determine the volume of production at which a change from loss to profit occurs. This type of analysis can be represented graphically:
The “Total costs” line is formed by adding two straight lines: “Fixed costs” and “Variable costs”. The point where revenue and total costs intersect is called the break-even point. It reflects the situation when the profit is 0. To the left and right of the break-even point are areas of loss and profit.
CVP analysis is a simplified model for assessing the situation in a company. Like all other models, it has a number of limitations:
- The selling price per unit does not change.
- Variable costs per unit are constant.
- Total fixed costs are fixed.
- Everything the company produces is sold, without reserve.
- Changes in production volume are the only factor that affects fixed and variable costs in the cost of production.
- If a company sells more than one product, their revenue ratio does not change.
What is the break-even point?
The break-even point is also called the critical production volume, break-even threshold or profitability threshold.
even point (critical point, CVP-point) is the volume of sales at which the company does not incur losses, but does not make a profit.
The break-even model is based on the Direct Costing cost determination system. In this system, the truncated cost is calculated, as well as the marginal profit (margin) is determined.
To determine the critical volume (break-even point), it is necessary to plot gross revenue ( TR - Total Result) and total costs ( TC - Total Cost) on one graph.
Break-even point and margin of financial strength
These figures can be calculated using a formula if you divide the costs into variable and fixed for your business. The formula for calculating the break-even point is as follows:
- Break-even point (in units) = Fixed costs / (product price - variable costs per unit)
If you multiply the break-even point in units by the price of the product, you get the amount of revenue for break-even production.
The formula works for enterprises producing only one type of product.
To calculate the margin of financial safety (FSA), you need to subtract the break-even point from the company’s revenue:
- ZFP = Revenue - Break-even point (in monetary terms)
The name of the indicator speaks for itself. It demonstrates the amount that a company can count on in case of unforeseen circumstances. The greater the margin of financial strength, the further the company is from an unprofitable state.
Formula
Average fixed (fixed) costs (AFC) are numerically equal to the result of dividing total fixed costs (FC) by output (Q):
AFC = FC/Q
The total costs (TC) of a firm are either fixed (FC) or variable (VC). This can be written mathematically as follows:
TC = FC + VC
If we divide both sides of the equation by output Q, we get:
TC/Q = FC/Q + VC/Q
ATC = AFC + AVC
The resulting equality shows that average fixed costs (costs) can also be defined as the difference between average total and average variable costs:
AFC = ATC - AVC
Break-even point for multiple products
In reality, you rarely see a company producing one type of product. Therefore, a method was invented to calculate the break-even level for a set of products. However, it has one important limitation: the share of different products in the company's revenue must be constant. In other words, whenever X units of product A are sold, Y units of product B and Z units of product C are also sold.
To better understand how to calculate the indicator, consider an example.
A certain company produces and sells two products: lemonade and water. Water sells for $7 per unit and has variable costs of $2.94 per unit, while lemonade sells for $15 per unit and has variable costs of $4.50 per unit. The marketing department estimates that for every 5 units of water sold, 1 unit of lemonade will be sold. The organization's fixed production and management costs are $36,000.
Let's calculate the break-even point for this company.
Step one: calculate the difference between price and variable costs per unit of production. This difference is also called the specific contribution margin.
- For water: 7 - 2.94 = $4.06
- For lemonade: 15 – 4.5 = 10.5 dollars.
Step two: calculate the marginal profit for the product set.
- (4.06 * 5) + (10.5 * 1) = $30.8
Step three: substitute the values into the break-even point formula:
- 36,000 / 30.8 = 1169 sets
Step four: calculate the number of products of each item that must be sold to make zero profit.
- 1169 * 5 = 5,845 bottles of water
- 1169 * 1 = 1169 bottles of lemonade
Step five: calculate the break-even point in monetary terms.
- (5845 * 7) + (1169 * 15) = $58,450
In order for production not to be unprofitable, the company needs to receive revenue of $58,450. Let us recall that this figure is correct only if five bottles of water are sold for every bottle of lemonade.
Margin analysis
This type of analysis is used to select the most profitable products. To apply it, it is necessary to divide costs into variable and fixed. The basic premise is that the capacity of any business is limited. The main concept is marginal income (MI) or marginal profit. The formula for calculating marginal income is:
- MD = Revenue - Variable costs
Or:
- MD = Profit + Fixed costs
Since fixed costs are shared across the entire enterprise, high-margin products should be prioritized. For clarity, let's look at an example again.
The company produces 3 types of products: crackers, chips and corn sticks. Prices, variable costs per unit and specific contribution margin are presented in the table:
| Product | price, rub. | Specific variable costs, rub. | Specific MD, rub. |
| Crackers | 15 | 5 | 10 |
| Chips | 40 | 20 | 20 |
| Corn sticks | 30 | 8 | 22 |
The company can only produce 20,000 packages per month. The maximum quantity of each type of product that can be produced: crackers - 14,000 packages, chips - 10,000, corn sticks - 8,000.
The maximum MD will be:
- (22 * 8000) + (20 * 10,000) + (10 * 2000) = 396,000 rub.
You can independently calculate the marginal income for all combinations and make sure that a set of 8,000 packs of corn sticks, 10,000 packs of chips and 2,000 packs of crackers is the most profitable.
Using marginal analysis, we used all production capacities and selected the most profitable set of products.
Fixed and variable expenses in accounting
Accounting for fixed and variable costs is optional. It is used by managers to make management decisions. However, in accounting, this division can be useful when calculating costs using the “Direct Costing” method.
It also adds a division into direct and indirect costs. The essence of this method of cost accounting is that the costs of producing products form production costs, and general business costs are written off as period expenses. The cost of production is accumulated on account 25, and production maintenance costs are accumulated on account 26. The entire amount of the 26th account is written off as expenses for the period, regardless of how many products were sold.