As part of the activity of producing goods, in order to assess the results of the labor component, it is necessary to know the value of the final result, i.e. total produced marketable products, regardless of the percentage of its readiness (production in progress). Gross output is a unique indicator that includes the amount of semi-finished products and goods not ready for sale.
Gross output
A productive indicator in production in natural units of measurement for a specific period of time, as the sum of all goods produced, regardless of the percentage of their readiness.
Gross output formula
VP = T + N \text{V}\text{P} = \text{T} + \text{N} VP=T+N
where T \text{T} T is the amount of goods produced according to the plan,
Н \text{Н} Н – balances of unfinished commodity output at the end of the period (difference between initial and final balances).
Calculation methods
- Factory - the difference between the total gross turnover and turnover within divisions (intra-factory).
- Element-by-element - a method of summing up all elements of the indicator (finished products, semi-finished products, production at the release stage, industrial work, repair work and raw materials).
Gross turnover is the total volume of products produced for a specific period of time, regardless of its use both for subsequent processing and for the purpose of sale.
Intra-factory turnover is the release of goods for subsequent use in the production process by its own workshops and divisions.
Features of gross output
- calculated by enterprises with a long production cycle of more than 2 months;
- used in analyzing the activities of industries with large output volumes;
- used to plan production costs, determine the need to purchase material resources, and analyze production dynamics.
What is gross profit and how does it differ from net profit?
Gross profit is considered one of the main indicators characterizing the efficiency of an enterprise. It is calculated as the difference between:
- net revenue from the main activity,
- the cost of goods or services.
Based on the obtained value, one can indirectly judge the profitability of the enterprise. Indirectly - since the indicators taken into account do not reflect complete information.
Thus, the term “net” in relation to revenue means that it is necessary to subtract from it:
- VAT,
- excise taxes,
- other obligatory payments (for example, export duties).
The cost indicator is formed by:
- costs of production and provision of services;
- the purchase price of the goods sold.
Commercial and administrative expenses are not included in the cost price; they are reflected in the financial performance statement separately and participate in the formation of the net profit indicator (clause 23 of PBU 4/99).
Actually, this is the difference between gross profit and net profit. The first serves, rather, to assess production costs, pricing efficiency, and return on production, since it is formed from indicators that are directly related to production.
While net profit is the final financial result of the enterprise’s activities for the reporting period, calculated as the difference between all recognized income and expenses (including taxes and mandatory payments).
Methods for calculating gross profit and a list of items that form it can be found in the article “How to calculate gross profit (calculation formula)?”
Accounting press and publications
"Accounting", N 1, 1999
PREPARATION OF ANNUAL REPORT IN AGRICULTURE
The annual report of agricultural enterprises (organizations) includes standard forms of accounting statements provided for in clause 2 of Order of the Ministry of Finance of the Russian Federation dated November 12, 1996 N 97, as well as specialized forms established in accordance with clause 31 of the Regulations on accounting and financial reporting in the Russian Federation. Federation, approved by Order of the Ministry of Finance of the Russian Federation dated July 29, 1998 N 34n.
Since the procedure for drawing up standard reporting forms is well known and is set out in detail in the Instructions on the procedure for filling out annual financial reporting forms (Appendix No. 2 to the Order of the Ministry of Finance of Russia dated November 12, 1996, with subsequent amendments and additions approved by Order of the Ministry of Finance of Russia dated November 21, 1997 N 81n) , we will focus on the procedure for filling out specialized forms of the annual report of agricultural enterprises and organizations approved by the Ministry of Agriculture and Food of Russia.
First of all, we note that the preparation of an annual report in each farm is preceded by significant preparatory work, which boils down to an inventory of the main types of assets and obligations with the write-off of identified deviations in purpose and adjustment of costs with the write-off of calculation differences and the closure of a number of operating accounts.
Simultaneously with the adjustment of expenses and closing of accounts, the balance of accounts 89 “Reserves for future expenses and payments”, 31 “Deferred expenses”, 83 “Deferred income” is updated so that the created reserves reflect only real sources for upcoming expenses and payments, and the amounts of expenses and income corresponded to the reporting periods to which they relate.
Currently, agricultural enterprises draw up specialized reporting forms only for the most important areas and types of activities: general performance indicators for the year; indicators on labor and wages; implementation indicators; indicators on production costs and production costs; data on the availability of animals and the movement of products.
Let's look at specific reporting forms drawn up in these five areas.
General performance indicators for the year
In agriculture, to assess the results of an enterprise's (organization's) activity for the year, the following system of indicators is used: gross output production in the main industries and in the economy as a whole; average annual number of employees; gross output per average annual worker (labor productivity); receipt of gross income (total and by main industries); remuneration of employees; electricity consumption; cost of fixed assets.
The specified data is reflected in the form of the annual report No. 6-APK “Main indicators”. Let's consider its content and order of compilation.
The first section provides data on gross output and labor productivity. To determine the gross output by industry, the amount of products received is taken from the data of production accounts 20-1 “Crop production”, 20-2 “Livestock production” and assessed in comparable 1994 prices.
Cultivation of forest plantations (silviculture) is not included in agricultural products; raw products obtained as a result of hunting, collecting wild fruits and berries; other finished products of nature, as well as products from slaughter and processing of raw agricultural products.
Next, the average annual number of workers employed in agriculture is determined (to calculate labor productivity). Since the accounting registers contain data on labor costs in man-hours for all industries, based on these data the share of labor costs in agriculture is established (for example, 80%). The average annual number of workers employed in agriculture is determined by multiplying the average annual number of workers in primary production (for example, 300 people) by the share of labor costs in agriculture (80%), the resulting result is divided by 100. We obtain the average annual number of workers employed in agriculture farm - 240 people.
Next, by dividing the total gross agricultural output by the found average annual number of workers employed in agriculture, the production of gross agricultural output per worker is obtained.
The second section provides data on calculating gross income. The gross income of an agricultural organization as a whole consists of balance sheet profit (loss) and wages with contributions for social needs for the main production; for the crop production sector - from wages with deductions for social needs for crop production, plus profit (or minus loss) for crop production, taking into account subsidies and compensation, minus costs for completely lost crops; for the livestock industry - from wages with deductions for social needs for the livestock industry, plus profit (or minus loss) taking into account subsidies and compensation, minus costs for the livestock industry that did not produce production.
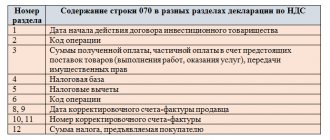
A separate line based on the data in account 70 “Settlements with personnel for wages” shows the amounts determined to be paid for labor from income received in the reporting year (basic and additional payment in cash and in kind, vacation payments, etc.). This does not include wages for workers employed in cultural and social institutions, in self-employed construction, as well as pensions, benefits, one-time financial assistance, etc.
At the end of the form, the certificate for individual codes shows the availability of tractors at the end of the year, the total power of mechanical, electric engines and the power of manpower servicing the production process. They separately show the electricity production by their own power plants and from outside, the total consumption of electricity, including for production needs.
The form ends with data on the average annual cost of fixed assets. A separate certificate indicates the property received under leasing, including accounts payable at the end of the year for leased property accepted on the balance sheet.
As we see, f. N 6-APK is quite cumbersome and reflects a wide variety of information, including secondary information, from which the annual report may well be exempt.
Labor and wage indicators
The annual report provides f. N 5-APK “Number and wages of agricultural enterprises (organizations).”
This form includes all employees of the farm, including workers engaged in construction carried out using economic methods, planting gardens, growing perennial plantings, and improving meadows and pastures. The form shows the average annual number of employees, guided by the Instructions on statistics of the number and wages of workers and employees at enterprises, institutions and organizations, approved by the State Statistics Committee of the USSR on September 17, 1987 N 17-10-0370.
A separate section of this report reflects the wage fund of employees and social payments, guided by the Instruction “On the composition of the wage fund and social payments”, approved by the State Statistics Committee of Russia on July 10, 1995 N 89 in agreement with the Ministry of Economy, the Ministry of Labor and the Central Bank of the Russian Federation.
For in-kind remuneration and other labor and social payments in kind, the report includes amounts based on market prices prevailing in the region. If goods or products were provided at reduced prices, then the difference between their full cost and the amount paid by the employee is reflected.
A separate certificate indicates: the number of man-days and man-hours worked by all employees, by individual categories and by the employees involved; number of employees on the payroll as of December 31, 1998; additional payments and allowances for length of service, length of service, class; payment for regular and additional vacations; the cost of food and products provided to employees free of charge, as well as at reduced prices.
At the end of the report, the distribution of labor in man-hours by main industries and activities is given.
It seems that f. N 5-APK and N 6-APK, without prejudice to the case, can be combined into one form “General performance indicators of an enterprise (organization)” with the exclusion of secondary data from it.
Sales indicators
Data on the sale of products, works and services, as well as fixed assets, intangible and other assets are reflected in f. N 7-APK “Product sales”. To compile the report, analytical accounting data for accounts 46, 47, 48 is used.
The report includes all types of products sold by industry, works and services, and other valuables. For each sales item they reflect the quantity of products sold or other valuables, the full cost and revenue excluding VAT, excise taxes and export customs duties. Separately, the table shows sales to federal and regional funds.
The report includes a certificate “In addition, subsidies and compensations received,” which shows the actual amounts of subsidies and compensations received from the federal budget and the budget of the federal subjects for each type. In this case, the amounts of subsidies and compensations are not included in sales revenue, although they are included in account 80 “Profits and losses”. When these amounts are received, an entry is made: debit account 51 “Current account”, credit account 96 “Targeted financing and receipts”, and at the end of the year they are written off to profit: debit account 96 “Targeted financing and receipts”, credit account 80 “ Profit and loss".
When repaying subsidies and compensation due from the budget by offsetting debt on a previously received commodity loan, an entry is made: debit account 95 “Long-term loans”, credit account 96 “Targeted financing and receipts”, followed by crediting the balance of account 96 to the credit of account 80.
Cost indicators
for production and costs
Three reporting forms are drawn up for production costs and prime costs - N 8-APK, N 9-APK, N 13-APK.
In f. N 8-APK “Costs of main production” reflect production costs for the main industries (crop production, livestock farming, auxiliary production, etc.) in the context of cost elements: wages with deductions for social needs, material costs (including components) , depreciation, other costs. Costs are divided into: total production costs, including crop and livestock products.
The element “Labor costs with deductions for social needs” reflects the wages of all personnel of the main activities of the economy, including involved persons, except for the wages of workers in housing and communal services and cultural institutions, trade and public catering, child care institutions and educational institutions , capital construction and other activities. This element also reflects wages for unpaid labor attributed to the main activity, and wages for loading and unloading work written off during the year to the accounts of material assets.
Costs for this element are collected by branches of production, for which they use data from accounts 20 “Main production”, 23 “Auxiliary production”, 25 “General production expenses”, 26 “General expenses”. In this case, the amounts of remuneration attributed to crop production and livestock production are calculated in the same manner as the distribution of man-hours (or man-days) when calculating labor productivity in f. N 6-APK.
For the element “Material costs” included in the cost of production, they reflect the cost of agricultural and industrial products, services of third-party organizations used for the production of farm products. In this case, material costs in crop and livestock production are determined in a simplified way, as the difference between all costs and other elements except material costs.
For this element, the report also reflects the main components of material costs: seeds and planting material, feed for agricultural and industrial production, mineral fertilizers used in the reporting year, petroleum products, electricity, fuel, spare parts, repair and construction materials for repairs, payment for work and services performed by third parties, etc.
The element “Depreciation of fixed assets” reflects the amounts accrued for the year and allocated to production depreciation, except for deductions for housing and communal services, the social sphere, child care institutions, trade, public catering, capital construction by economic means, etc.
The element “Other costs” reflects: taxes attributed to expenses (land tax, etc.), fees, payments for maximum permissible emissions of pollutants, rewards for inventions and innovation proposals, interest payments on loans, business trip costs , lifting, payment to third-party organizations for fire and guard protection, for training and retraining of personnel, payment for communication services, computer centers, banks, depreciation of intangible assets, rental payments for leased land shares, insurance payments for crop insurance, leasing payments, as well as other intangible costs included in the cost of production.
In f. N 9-APK “Production and cost of crop products” reflects the costs of production of crop products and their cost. Fill out the form based on analytical accounting data for account 20-1 “Crop production”.
The report includes data on the production of all types of crop products and the costs of their cultivation. First of all, the area under crops is reflected for each crop.
The second step in filling out the report is to indicate the mass of products obtained for each crop.
The third stage is to fill in the column “Costs - total” for each crop based on the relevant analytical accounting data for each crop in account 20-1 (with the exception of costs for completely destroyed crops that did not produce any products). These costs are written off from account 20 to the debit of account 65 “Calculations for property and personal insurance”, and for uninsured crops - to the debit of account 80 “Profits and losses”, i.e. at a loss.
The next step is to determine the cost of the resulting products. To do this, the amount of costs for each crop is attributed to the products received. If one type of product is obtained from a crop, then all costs for the crop are attributed to it. If the main and by-products are obtained, then part of the costs is attributed to the by-products, and the rest to the main ones. If several types of main products are received, then costs are distributed between them according to specially established coefficients or in proportion to the cost of each type of product in selling prices, etc. For each type of product, direct labor costs for the product are indicated (total man-hours).
K f. N 9-APK provides several information on the main branches of crop production.
In f. N 13-APK “Production and cost of livestock products” includes data on the production of all types of livestock products and the costs of raising, rearing and fattening livestock, both our own and those received from participating farms. Costs for livestock sectors that did not produce products are not included in the form.
The form displays data for each livestock sector line by line.
The columns in the report reflect the main indicators characterizing the state of each livestock sector: average annual livestock, maintenance costs (including wages with deductions for social needs, feed, costs of maintaining fixed assets). Next, the columns reflect the output of each group of animals. The last columns determine the cost of each type of livestock product.
The costs of maintaining the corresponding type of animal include data from analytical accounting in the debit of subaccount 20-2 “Livestock”. At the same time, the costs of maintaining sire bulls are also included in the costs of the main dairy herd.
The column “Payment with deductions for social needs” reflects only direct remuneration of workers with deductions employed directly in the production of livestock products.
The column “Feed” reflects the actual cost of all types of feed spent on keeping animals, including the cost of green mass of cultivated pastures, seeded feed fed to animals by grazing. The costs of preparing feed in feed shops and feed kitchens are also reflected in this article.
The column “Costs for maintaining fixed assets” reflects the costs of maintaining livestock production buildings, working machines and equipment used directly in the production of livestock products.
The product of animals in growing and fattening is their weight gain (increase in live weight minus the weight of dead animals). Milk produced from beef cows is considered a by-product and is valued at selling prices.
In egg poultry farming, the main products are eggs obtained from adult birds. Eggs obtained from young poultry are considered a by-product of raising young poultry, and their value is shown on a separate line.
Costs for work in progress in livestock production are not shown in this report, but are reflected only in the corresponding line in the balance sheet asset (this includes work in progress in fish farming, in poultry farming - incubation of eggs and in beekeeping - stock of honey in hives for winter feeding of bees).
The distribution of costs between individual types of livestock products obtained from individual types of animals is carried out according to the procedure established by the relevant methodological recommendations. In dairy farming between milk and offspring: 90% for milk and 10% for offspring; in sheep farming, the costs of wool and live weight gain are distributed in proportion to the consumption of feed for these types of products according to established standards. Sheep shearing costs apply to sheep only.
Indicators of the presence of animals
and product movement
Data on the availability of animals and the movement of products in the annual report are presented in f. N 15-APK “Presence of animals” and f. N 16-APK “Product Balance”.
In f. N 15-APK show the number and total book value of animals by main groups and species. The availability of animals also includes livestock transferred for rearing to private individuals under contracts. Livestock accepted from the population for sale on behalf of the owner is not included in the report.
At the end of the report, reference data is provided on the following indicators: losses from mortality and death of animals (at book value), lambs received for the reporting year, number of sheep at the end of the year.
In f. N 16-APK “Product Balance” reflect the movement of agricultural products for the reporting year. For each type or group of products (cereals, sugar beets, sunflowers, potatoes, vegetables, etc.) they show the availability at the beginning of the year, gross collection minus unused waste, purchase and receipt from outside and consumption of products through the main channels of its use .
At the end of the form, a certificate is given about the sale and issuance of products to workers of the farm as payment for labor, as well as about the sale on the collective farm market (at actual selling prices).
Signed for seal by M.Z. Pizengolts
12/15/1998 Professor
Russian state
Agrarian Correspondence University
—————————————————————————————————————————————————————————————————— ———————————————————— ——
Reflection of gross profit in reporting
As previously mentioned, gross profit is displayed in the financial results report, the form of which was approved by Order of the Ministry of Finance dated July 2, 2010 No. 66n, namely in line 2100.
The indicators “Revenue” and “Cost of sales” are reflected in lines 2110 and 2120, respectively.
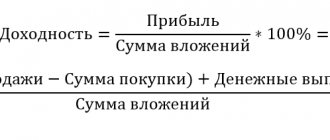
Thus, gross profit in the report is formed according to the formula:
The amount of gross profit can be either positive or negative. In the second case, the indicator means a loss and is entered in line 2100 in parentheses without the minus sign.
The cost price must also be indicated in parentheses (the minus sign is not used).
The article “Filling out Form 2 of the balance sheet (sample)” will introduce you to a description and decoding of all the lines of the statement of financial results.
Let's take a closer look at what data is used to form the amount of revenue and cost.
What does revenue come from?
Line 2110 includes data on income from ordinary activities, the definition of which is given in paragraphs. 5, 12 PBU 9/99. Let us remind you that this indicator is entered minus VAT amounts. This is indicated to us by approx. 5 of Appendix No. 1 to Order of the Ministry of Finance dated July 2, 2010 No. 66n, as well as the list of receipts that are not recognized as income of the enterprise, published in paragraph 3 of PBU 9/99.
Revenue is accounted for in account 90.1 separately for each type of activity. The amounts of VAT and excise taxes are displayed on accounts 90.3 and 90.4, respectively. Graphically, the formula for calculating the “Revenue” item can be presented as follows:
What is the cost formed from?
Line 2120 is formed based on data on expenses for ordinary activities described in paragraph 5 of PBU 10/99.
According to the instructions for using the Chart of Accounts, the cost of products, goods, and services is accounted for in account 90.2. Write-off of cost is recorded by posting:
Dt 90.2 Kt 20, 23, 29, 40, 41, 43, etc.
It should be taken into account that commercial and administrative costs are also accumulated in account 90.2. And they, as we know, do not form the line indicator 2120. These expense items are drawn up in correspondence with accounts 26 and 44.
Examples of problem solving
Example 1
Determine gross output for the year if work in progress at the beginning of the year amounted to 1,520 thousand rubles. at the end of the year 1250 thousand rubles, and the volume of finished products 3560 thousand rubles.
Solution
According to the formula
VP = T + N = 3560 + ( 1520 − 1250 ) = 3830 \text{V} \text{P} = \text{T} + \text{N} = 3560 + (1520-1250) = 3830 VP=T +H=3560+(1520−1250)=3830 thousand rubles.
Answer: The volume of gross output is 3830 thousand rubles.
Example 2
Production balances at the manufacturing stage in the base period amounted to 220 thousand rubles. at the beginning and 180 thousand rubles. at the end of the year. This year, at the end of the period, they are equal to 160 thousand rubles. How much has the volume of output of finished products changed if, according to the results of last year, the gross output amounted to 350 thousand rubles. and this year it increased by 15%?
Solution
Gross output of the base period
V P 0 = T 0 + N 0 = 350 \text{V}\text{P}_0 = \text{T}_0 + \text{N}_0 = 350 VP0=T0+N0=350
T 0 = 350 − ( 220 − 180 ) = 310 \text{T}_0 = 350-(220-180) = 310 T0=350−(220−180)=310 thousand rubles.
Gross output of the current period
V P 1 = T 1 + N 1 = 350 ⋅ 1, 15 \text{V}\text{P}_1 = \text{T}_1 + \text{N}_1 = 350\cdot1.15 VP1=T1 +H1=350⋅1.15
T 1 = 350 ⋅ 1, 15 − 180 + 160 = 382, 50 \text{T}_1 = 350\cdot1.15-180 + 160 = 382.50 T1=350⋅1.15−180+160=382 .50 thousand rub.
Change: 382.50 − 310 = 72.5 382.50-310 = 72.5 382.50−310 = 72.5 thousand rubles.
Answer: The output of finished products increased by 72,500 rubles.
The calculation of gross output is used mainly within the enterprise itself; external users are more interested in information about the net output of marketable products. It is the fact of the influence of work in progress that is the disadvantage of using the “gross output” indicator in activity analysis.
Results
Gross profit represents the excess of revenue from sales and provision of services over their cost.
Otherwise, the indicator indicates that the product is not profitable. Information on the amount of gross profit/loss is presented in line 2100 of the financial result report and is calculated as the difference between lines 2110 and 2120. You can find more complete information on the topic in ConsultantPlus. Free trial access to the system for 2 days.