The thickness and complexity of the report reliably protect it from the danger of being read. Winston Churchill, Brit. Prime Minister
Most companies hide their financial situation not because they are afraid of competitors, but because they are afraid of their owners. Jack Stack, American businessman
Fundamental analysis is unthinkable without studying the company's profit. In everyday understanding, profit is a very simple indicator: we counted all income, calculated all expenses, subtracted the second from the first, and got the profit amount. This approach is not enough to correctly assess the financial condition of a company.
There are many profit indicators: gross profit, operating profit, net profit, before taxes, per share, and so on. A savvy investor must understand what stands behind these words and abbreviations.
Calculation formula
To calculate VP, it is customary to use the following formula:
VP = B – C, where:
- B – revenue;
- C – cost including depreciation.
For trade organizations the following option is more suitable:
VP = VD – C, where:
- VT – gross income.
Revenue is money received for the sale of a service/work/product. This is the amount that the buyer leaves in the store and thereby pays the cost of the product itself, the costs of pre-sale preparation, the amount of taxes (VAT, excise taxes), and service. Revenue includes only those receipts that arose as a result of the main activity. This is the cash flow that flows through the organization.
Gross income is the amount of revenue from the sale of goods/services, fixed assets, shares, intangible assets, intellectual property rights, calculated by the formula:
VD = (T x SPN)/100, where:
- T – trade turnover;
- SPN – average percentage of premium.
Reference! The main difference between gross income and revenue is that gross income includes turnover from other activities.
Cost is the cost of production and sales costs. It includes:
- Amounts spent on the purchase of raw materials and materials for the manufacture of products, or expenses on the acquisition of goods for further resale.
- Depreciation of fixed assets.
- Payment of labor and social contributions to employees directly and indirectly involved in the production/resale process.
- Advertising and marketing expenses.
The cost does not include administrative and commercial expenses.
Reference! Depreciation of fixed assets is a gradual write-off of the cost of purchasing fixed assets (buildings, structures, equipment, patents, etc.) in the periods subsequent to the acquisition.
In other words, if a company bought a machine for 10 million rubles, then it does not reflect the entire cost on the balance sheet, otherwise it will result in a loss, but writes off the purchase amount in small shares over several years.
Gross income at the enterprise
Definition 1
Gross income is an index of financial performance that shows the amount of profit that was received as a result of core activities without deducting management and commercial expenses.
Gross profit is also called contribution margin or contribution margin. Essentially, this is an indicator of the difference between the company's revenue and various company costs.
This difference is calculated using the following formula:
\(VP=V-C\)
\(VP\) is gross profit, the level of which is measured in rubles, \(B\) is revenue (also calculated in rubles), \(C\) is the cost of sales of the enterprise (in rubles).
When submitting a report by the accounting department, and more specifically, a report on the financial results of the enterprise, this coefficient is displayed in the line \(2100\).
This formula can be displayed using the program lines: \(VP=2110-2120\), where
\(2110\) is a page that displays the revenue indicator in rubles, and 2120 is the cost of sales in rubles. It is worth considering that the cost price is shown without taking into account expenses for commercial and administrative activities.
Did not you find what you were looking for?
Just write and we will help
Calculating an organization's gross profit ratio is not done just like that. It is necessary to assess the efficiency of the enterprise, as it is its main indicator. This indicator makes it possible to determine whether it is worth releasing a new product or continuing to produce old ones, to monitor the level of variable expenses, to develop opportunities to reduce these expenses, and also to track the mutual relationship in the concepts of “costs - production scale - income”.
What determines the size of the VP?
The size of the VP is influenced by external and internal factors.
The scope and specifics of the company’s activities, its location, the size of the enterprise, audience coverage, and the demand for the product are of decisive importance. Table 1. Factors influencing EBIT
| Domestic | External |
| Product/service price | Tax amount |
| Advertising and promotion costs | Demand management measures |
| Competitiveness | Changing consumer demand |
| Revenue from sales of goods | Political climate |
| Costs of bringing products/services to the end consumer | Emergence of new competitors |
| Product output volume | Litigation |
| Goods turnover rate | License revocation |
Internal factors depend on the actions taken by the organization itself, external factors depend on other independent aspects of the market economy. All of them affect costs and sales volumes.
Rice. 1. Gross profit growth
Unsold goods occupy a special place. They are in warehouses and cause losses. They may be unsold for various reasons: a drop in demand, there was a large supply, the human factor (they were not put up for sale), seasonality, a change in fashion trends. To sell such goods faster, they use marketing tricks: they assign discounts and organize promotions. You can return goods to the supplier if they were taken for sale.
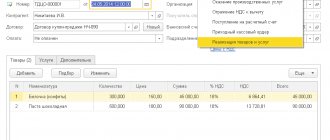
Detailing by item in the report “Gross profit of the enterprise”
Let's assume that we require data on profit and profitability for each product item. In the report form, click the “Settings” button to open the settings window. On the “Structure” tab, you can enable some additional analytical sections. Let’s check the “Nomenclature, Characteristics, Series” flag in the “By departments” group.
Then click “Close and Generate”:
The report has been generated anew; in the “By divisions” section, data on nomenclature has appeared. We see that the percentage of return on sales for different products differs significantly - from 11.94% to 34.28%:
VP distribution
VP includes all expenses that are associated with the main activities of the company. Therefore, funds received from the sale of products/services must be distributed wisely so as not to miss a single expense item.
Costs covered by VP:
- Space rental.
- Interest on obligations (credits, borrowings).
- Payment of taxes (income tax).
- Other mandatory expenses.
The final balance results in net profit, from which the enterprise's income is formed. It is already sent to reserve funds, for personnel training, expansion, diversification, and development of the company.
Balance of other expenses and income
Other activities of the enterprise in the financial statements are an analytical indicator called the “balance of other expenses and income.” This coefficient is measured by the difference between these indicators.
When submitting an accounting report on the financial performance of an organization, this is displayed as follows:
Other income is shown in the following lines:
- 2310 - profit from participation in other organizations;
- 2320 - percent of income;
- 2340 - other income.
Expenses (other) are displayed in the following lines:
- 2330 - the amount of interest that must be paid;
- 2350 - other expenses.
Is it difficult to figure it out on your own?
Try asking your teachers for help
Solving problems Tests Essays
The balance of these coefficients can be calculated using the following formula:
\(Spr=2310+2320+2340-2330-2350\) (the numerical indicator indicates the line number in the report), where \(Spr\) is the balance of other income and expenses. This indicator is also measured in rubles.
Calculation example
For analysis, balance sheet data for the year, quarter or month is used.
calculations can be made in Excel. Table 2. VP over time, thousand rubles.
| Month | Revenue | Cost price | Gross profit | Gross profit 2021 to 2016 | ||||
| 2016 | 2017 | 2016 | 2017 | 2016 | 2017 | Deviation | Height,% | |
| January | 125 000 | 185 000 | 65 000 | 98 000 | 60 000 | 87 000 | 27 000 | 145,0 |
| February | 134 000 | 210 000 | 75 000 | 110 000 | 59 000 | 100 000 | 41 000 | 169,5 |
| March | 119 000 | 176 000 | 55 000 | 99 000 | 64 000 | 77 000 | 13 000 | 120,3 |
| April | 95 000 | 148 000 | 45 000 | 75 000 | 50 000 | 73 000 | 23 000 | 146,0 |
| May | 75 000 | 129 000 | 40 000 | 78 000 | 35 000 | 51 000 | 16 000 | 145,7 |
| June | 87 000 | 125 000 | 42 000 | 67 000 | 45 000 | 58 000 | 13 000 | 128,9 |
| July | 116 000 | 166 000 | 46 000 | 68 900 | 70 000 | 97 100 | 27 100 | 138,7 |
| August | 127 000 | 175 000 | 60 000 | 75 000 | 67 000 | 100 000 | 33 000 | 149,3 |
| September | 141 000 | 187 000 | 75 000 | 98 500 | 66 000 | 88 500 | 22 500 | 134,1 |
| October | 156 000 | 197 000 | 85 000 | 115 000 | 71 000 | 82 000 | 11 000 | 115,5 |
| November | 177 000 | 240 000 | 91 000 | 135 000 | 86 000 | 105 000 | 19 000 | 122,1 |
| December | 195 000 | 275 000 | 95 000 | 167 000 | 100 000 | 108 000 | 8 000 | 108,0 |
| Year | 1 547 000 | 2 213 000 | 774 000 | 1 186 400 | 773 000 | 1 026 600 | 253 600 | 132,8 |
The table shows that the VP indicator for each month of 2021 is higher than it was in 2016. This means that the company is doing better, despite the seasonal drawdown from March to June. The growth for the year amounted to 253,600 thousand rubles. or 132.8%.
Rice. 2. VP in dynamics
Important! When calculating revenue and costs, you need to keep in mind the real level of inflation, since it directly affects price increases.
Earnings per share
Profit growth is good. But investors are interested in their own income. How much did the company earn for me personally? For a rough estimate, the earnings per share (EPS) indicator is used. This indicator uses the theory that all company profits one way or another go to shareholders - either paid in the form of dividends or invested in business development, which leads to an increase in the stock price. The investor has no other sources of income, so the long-term growth in the share price will be equal to EPS minus dividends per share (DPS).
Coca-Cola's EPS is $1.90 and its dividend is $1.48. The company has nowhere to develop; it simply gives money to shareholders in the form of cash. It is not surprising that analysts predict growth of the company's quotes in the region of 2-6% per annum. Now take Wal-Mart: EPS = 4.35, DPS = 2.04. The company continues expansion, so analysts predict 7-11% annual growth.
If I compare the EPS to the stock price, I can "estimate" what purchase price is appropriate for me. Let's say I want to buy Wal-Mart and expect 10% per annum. If EPS remains at 4.35, then my acceptable share price would be $43.5. If I expect the company to grow earnings by 10% per year, then an acceptable price would be $69.3. If I am confident that the company can maintain earnings growth at 20% per year, then my price will be 112.9. As you can see, instead of analyzing the current situation, we are making predictions and assumptions. I do not recommend building your financial future on such a foundation.
But it can be useful to compare the dynamics of net profit as a whole and EPS. For example, a company can buy back its shares from the market or conduct an additional issue. In these cases, an increase in net income in absolute terms may be accompanied by a deterioration in profitability for each investor.
Detailing by clients in the “Enterprise Gross Profit” report
To set up detailing by clients, open the settings form in the report again. There is no Customer field on the Structure tab. Let's enable the advanced settings view, then it will be possible to add fields. Let’s select the “Organization” field with the cursor (so that in the report the details for clients will be expanded within the organization), click “Add” and select “Client” from the list of available fields:
The “Client” field will appear in the report structure settings.
Click “Close and Generate”. The report has been generated anew, with data for each client (in our example there is only one client so far).
Saving a report customization option
In order not to specify the setting each time, we will save it in the report. Click the “Report Options” button and select “Save Report Option”. In the form that opens, we indicate the name of our report (arbitrary) and its availability - only for the author or for all users. Then click “Save”.
After closing the report, we will see that the saved option has appeared in the sales reporting panel:
There are also options for setting up the report already specified in the program. They are available via the same “Report Options” button. To include options in the report panel, click the "Settings" button in the report panel.