The concept of factor analysis
Factor analysis is a multidimensional technique that allows you to study the relationships between the parameters of variables. In the process, the structure of covariance or correlation matrices is studied. Factor analysis is used in a variety of sciences: psychometrics, psychology, economics. The basics of this method were developed by psychologist F. Galton.
How does accounting policy affect profit ?
Objectives of the
To obtain reliable results, a person needs to compare indicators on several scales. In the process, the correlation of the obtained values, their similarities and differences is determined. Let's consider the basic tasks of factor analysis:
- Detection of existing values.
- Selection of parameters for a complete analysis of values.
- Classification of indicators for system work.
- Detection of relationships between resultant and factor values.
- Determining the degree of influence of each factor.
- Analysis of the role of each value.
- Application of the factor model.
Every parameter that affects the final value must be examined.
Some features of factor analysis
This method can be used comprehensively, in aggregate, as well as separately (single-factor). Every parameter that affects the final result is examined. Therefore, in this case, an important step is the correct selection of these same influencing factors. Schematically, the entire process of preparation and analysis itself can be displayed as follows:
- Determining the goals and objectives of FA.
- Selection of indicators on which the financial result of the enterprise depends.
- Selection and systematization of factors influencing selected indicators.
- Calculations, clarification, study of the degree of dependence between selected factors and final indicators.
- Assessment of the influence and role of each parameter separately.
As noted earlier, the financial result of an enterprise is characterized by two key components: the amount of profit received for a specific period and the level of profitability (R). They are studied in three stages.
| FA of profit and profitability (general algorithm) | ||
| 1 | 2 | 3 |
| Assessing the dynamics of profit and profitability indicators | Study and analysis of factors influencing profit margins and profitability levels | Determining the reserve for increasing profits and profitability |
So, one of the key points in factor analysis is the assessment of parameters that affect profit. Since there are actually quite a lot of such factors, they are first systematized, and only then proceed directly to the analysis.
There are internal and external factors, under the influence of which changes in economic indicators occur. External ones do not depend on the activities of the enterprise, but significantly affect its profitability. These are, for example, the applied taxation regime and pricing.
Internal, on the contrary, are directly related to the operation of the enterprise. These include, for example, production volumes, sales, as well as the quality of products sold, reduction of production costs, etc. Thus, high-quality products, increased production and sales volumes significantly contribute to increased profits.
| Business valuation | Financial analysis according to IFRS | Financial analysis according to RAS |
| Calculation of NPV, IRR in Excel | Valuation of stocks and bonds |
Factor analysis techniques
FA methods can be used both in combination and separately.
Deterministic Analysis
Deterministic analysis is used most often. This is due to the fact that it is quite simple. Allows you to identify the logic of the impact of the company’s main factors and analyze their impact in quantitative terms. As a result of the DA, you can understand what factors should be changed to improve the company's performance. Advantages of the method: versatility, ease of use.
Stochastic analysis
Stochastic analysis allows you to analyze existing indirect relationships. That is, there is a study of indirect factors. The method is used if it is impossible to find direct connections. Stochastic analysis is considered complementary. It is only used in certain cases.
What is meant by indirect connections? With a direct connection, when the argument changes, the value of the factor will also change. An indirect connection involves a change in the argument followed by a change in several indicators at once. The method is considered auxiliary. This is due to the fact that experts recommend studying direct connections first. They allow you to create a more objective picture.
The methodology for analyzing the impact of inflation on financial results from product sales can be presented in the form of five stages .
Calculation methods for factor analysis
In practice, different methods are used as a basis: some take only 3 key factors (income, selling price and cost) as a basis, others consistently determine the impact of each factor on profit. The main source of data can be taken from financial statements or made calculations based on other indicators. Often several series of calculations are carried out to compare the data obtained and arrive at average values.
Absolute difference method
In this case, 3 criteria are taken for factor analysis:
- sales volume for the reporting period (expressed in kind - a unit of goods or services sold);
- selling price per unit of goods;
- cost in terms of 1 unit of goods or services.
The impact on profit of each of these parameters is considered; calculations are made using the following formulas (f - actual, p - planned):
Pf = Vf * (Tsf – Sed)
P = Pf – Pp
P – profit, V – sales volume, C – selling price Ced – cost per unit. Obviously, according to this formula, profit is proportional to sales volume. Therefore, according to the second formula in such cases, a positive difference will always be obtained, i.e. The company's revenue is growing.
Chain substitution method in factor analysis
In this case, the influence of each factor is determined separately, but the same formulas are used. For example, changes in sales volume in the summer season are first analyzed, then in the fall, winter and then spring seasons. They obtain several profit values (in this case 4) and identify their relationship with seasonality or with other parameters (customer flow, increase in purchase prices, decrease in prices for raw materials, etc.).
Stages and features of factor analysis
Analysis for each factor gives objective results. However, it is used extremely rarely. This is due to the fact that complex calculations are performed in the process. To carry them out you will need special software.
Let's consider the stages of FA:
- Establishing the purpose of the calculations.
- Selection of values that directly or indirectly affect the final result.
- Classification of factors for complex research.
- Detecting the relationship between the selected parameters and the final indicator.
- Modeling of mutual relationships between the result and the factors influencing it.
- Determining the degree of impact of the values and assessing the role of each parameter.
- Use of the generated factor table in the activities of the enterprise.
FOR YOUR INFORMATION! Factor analysis involves very complex calculations. Therefore, it is better to entrust it to a professional.
IMPORTANT! When carrying out calculations, it is extremely important to correctly select factors that influence the results of the enterprise. The selection of factors depends on the specific area.
Factor analysis of enterprise revenue
Factor analysis is one of the methods of economic analysis that helps determine the influence of individual factors on changes in the results of an enterprise. In the process of factor analysis of indicators, a multifactorial relationship is built, followed by analysis and identification of the influence of each individual factor on the final result.
An enterprise is an open system consisting of numerous interdependent parts - subsystems. Non-current non-financial assets, current tangible assets, personnel and finance can be distinguished as subsystems of an enterprise. In the economics of an enterprise, they act as production resources (Fig. 1). The organization (process) and the economy act as the environment (according to Kleiner: the environment is a system of interaction of economic objects and the place where economic processes take place).
Rice. 1. Subsystems and internal environment of the enterprise
Non-current non-financial assets. The subsystem includes tangible and intangible assets: fixed production assets, intangible (intellectual) assets, capital investments. They have a long life cycle - at least a year.
Current tangible assets. The subsystem includes inventory assets (inventory, work in progress, finished products in the warehouse and for shipment). They have a short life cycle - no more than a year, and for some assets - equal to the production cycle.
Staff. The subsystem includes employees of the organization by category: permanent and temporary workers, managers, specialists and employees. Personnel are hired for a certain period of time. It belongs to the attracted resources.
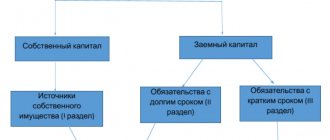
Finance. The subsystem includes own and borrowed funds. This is cash in kind, in the form of account entries or other financial documents (stocks, bonds, etc.).
Organization. The environment is described by a list of divisions included in the enterprise, interactions between them, functional responsibilities of divisions and individual employees.
Economy. The environment is described by a list of economic characteristics of resources and financial results of the enterprise (
Factor analysis of profitability
A profitability analysis is carried out to analyze the rationality of resource allocation. As a result, it is possible to determine which factors most influence the final result. As a result, only those factors that best influence efficiency can be retained. Based on the data obtained, you can change the company's pricing policy. The following factors may influence the cost of production:
- fixed costs;
- variable costs;
- profit.
Reducing costs provokes an increase in profits. In this case, the cost does not change. We can conclude that profitability is affected by existing costs, as well as the volume of products sold. Factor analysis allows us to determine the degree of influence of these parameters. When does it make sense to do it? The main reason for this is to reduce or increase profitability.
Factor analysis is carried out using the following formula:
Rв= ((W-SB -KRB-URB)/W) - (WB-SB-KRB-URB)/WB, where:
VT – revenue for the current period;
SB – cost price for the current period;
KRB – commercial expenses for the current period;
URB – management expenses for the previous period;
VB – revenue for the previous period;
KRB – commercial expenses for the previous period.
Other formulas
Let's consider the formula for calculating the degree of impact of cost on profitability:
Rс= ((W-SBot -KRB-URB)/W) - (W-SB-KRB-URB)/W,
CBO is the cost of production for the current period.
Formula for calculating the impact of management expenses:
Rur= ((W-SB -KRB-URot)/W) - (W-SB-KRB-URB)/W,
URot is management expenses.
The formula for calculating the impact of business costs is:
Rк= ((W-SB -KRo-URB)/W) - (W-SB-KRB-URB)/W,
CR is commercial expenses for the previous time.
The total impact of all factors is calculated using the following formula:
Rob=Rv+Rс+Rur+Rk.
IMPORTANT! When making calculations, it makes sense to calculate the influence of each factor separately. Overall PA results are of little value.
Example
Let's consider the organization's indicators for two months (for two periods, in rubles). In July, the organization's income amounted to 10 thousand, production costs - 5 thousand, administrative expenses - 2 thousand, commercial expenses - 1 thousand. In August, the company's income amounted to 12 thousand, production costs - 5.5 thousand, administrative expenses - 1.5 thousand, commercial expenses - 1 thousand. The following calculations are carried out:
R=((12 thousand-5.5 thousand-1 thousand-2 thousand)/12 thousand)-((10 thousand-5.5 thousand-1 thousand-2 thousand)/10 thousand)=0.29-0, 15=0.14
From these calculations we can conclude that the organization’s profit increased by 14%.
Concept and purpose of factor analysis
When assessing the activities of an organization for the reporting period, management or an entrepreneur is primarily interested in profit. This indicator, in turn, depends on several factors. It can be traced taking into account:
- trade turnover;
- number of product positions (assortment);
- costs associated with the purchase of goods;
- cost and selling price;
- flow of clients, etc.
Thus, factor analysis makes it possible to understand exactly which factors influence the parameter under study, and to what extent (i.e., to establish specific quantitative relationships). Also, thanks to factor analysis, it is possible to track internal connections between factors. If there are stable patterns, a correlation can be established, for example, between the flow of customers and the company’s product range. Obviously, an enterprise with a large number of customers can potentially provide a wider range of products, while a small company can provide a narrower one.
The main purpose of factor analysis is to establish the reasons for the decline or growth of profits in order to formulate specific types for the further development of the company. Understanding the factors on which the implementation of the sales plan depends makes it possible to obtain reliable data on the current market conditions and make appropriate decisions.
Factor analysis of sales profit
Factor analysis is a method of complex and systematic measurement and study of the influence of factors on the size of the final indicators. It is carried out on the basis of accounting. report on the second form.
The main purpose of such an analysis is to find ways to increase the profitability of the company.
The main factors that influence profit margins are:
- Product sales volume . To find out how it affects profitability, you need to multiply the change in the number of goods sold by the profit of the previous reporting period.
- Variety of products sold . To find out its impact, you need to compare the profit of the current period, which is calculated based on the cost and prices of the base period, with the base profit, recalculated for the change in the number of products sold.
- Change in cost . To find out its impact, you need to compare the cost of sales of goods in the reporting period with the costs of the base period, which are recalculated for changes in the level of sales.
- Commercial and administrative costs . Their impact is calculated by comparing their sizes in the base period and the reporting period.
- Price level. To find out its impact, you need to compare the sales level of the reporting period and the base period.
Example of factor analysis of economic profit
Initial information for calculating the influence of factors on the change (increase) in profit from sales according to f. No. 2 “Report on financial results” and other accounting data of OJSC “Arkhangelsk Sales Company”.
The price in this case was taken from the actual average selling price from the annual report. In 2007 it amounted to 203.5 kopecks/kWh, and in 2009 – 261.15 kopecks/kWh.
Background information
| № | Indicator and its symbol | 2008 | Sales in 2008 at prices and costs of 2007 (special calculation) | year 2009 |
| 1 | Revenue from product sales, rub. N | 7.855.810 | 6.495.705 | 8.335.890 |
| 2 | Cost of products sold, rub. S | 6.270.738 | 5.185.063 | 6.527.079 |
| 3 | Selling expenses, rub. KR | 3.434.598 | 2.839.953 | 3.343.507 |
| 4 | Profit (loss) from sales, rub. R | -1.849.526 | -1.529.311 | -1.534.696 |
| 5 | Sales revenue growth rate, calculated in prices of the previous (base) year, % | 7.855.810 | 6.495.705 | 82,68 |
Let us summarize the results of the factor analysis of sales profits in tabular form.
Table. Data received
| Factors of change in sales profit | Calculation results, rub. | Assessment of the influence of a factor on changes in sales profit, rub. |
| A. Total change in sales profit | — | |
| Including due to factors: | ||
| 1. Change in sales volume | +320.338 | |
| 2. Change in cost of goods sold | -1.342.016 | |
| 3. Change in business expenses | -503.554 | |
| 4. Changes in prices for products sold | +1.840.185 | |
| 5. Changes in structural shifts in sales volume | -123 | |
| B. The cumulative influence of factors on changes in sales profit | — |
Conclusions of factor analysis of sales profit
This study showed that sales profit increased only due to the influence of two factors: changes in sales volume (+320,338 rubles) and an increase in prices (tariffs) for products (+1,840,185 rubles). Other factors - an increase in the cost of sales, commercial expenses, as well as a change in the sales structure - led to a decrease in sales profit by a total of RUB 1,845,693.
The above calculations clearly show that this organization has sufficient reserves to increase profits from sales of products, primarily by reducing production costs of sales and commercial expenses. The magnitude of the change in structural shifts in sales volume is insignificant, which is explained by the fact that the enterprise sells one type of product – electricity.