Most people without economic education evaluate the effectiveness of commercial activities solely by trade margins, counting, for example, a difference of 50 rubles.
between the purchase of goods at 100 rubles per unit. and its sale at 150 rubles/unit. net profit of 50%. This approach does not adequately reflect the return on invested capital.
After all, when purchasing a low-quality batch of products or in the event of a sharp drop in demand, the business will come to a standstill due to insufficient (lack of) working capital.
How can one qualitatively analyze the financial and economic processes of a medium or large company that attracts investments, uses credit, carries out a large number of current operations, invests in expanding production and working capital?
Running a business requires the owner to systematically evaluate results . This allows you to analyze the efforts expended on efficiency, as well as draw conclusions regarding the prospects for the development of entrepreneurial activity.
One of the most important factors in economic analysis, reflecting the effectiveness of business processes, is profitability.
It is worth noting that this is a relative value, which is calculated by comparing several indicators.
Kinds
Profitability comprehensively reflects how effectively natural resources, labor, material and monetary resources are used. It is expressed in profit:
- per unit of investment;
- each unit of cash received.
The ratio of profit to resources, assets or flows that form it allows us to obtain percentage quantitative profitability ratios.
There are many types of profitability:
- turnover;
- capital;
- salaries;
- products;
- production;
- investments;
- sales;
- fixed assets;
- assets, etc.
Each type has a number of individual characteristics that are important to take into account for the correct calculation of indicators.
What does it depend on
The return on assets indicator makes it possible to determine the discrepancies between the level of profitability that was predicted and the actual value, and also to identify the factors that caused such deviations.
Often, such a calculation is used to compare the productivity of several companies in one industry.
In general, profitability is influenced by a lot of factors that act directly or indirectly:
- internal (production assets, volume of assets, trade turnover, labor productivity, technical equipment);
- external (competitive pressure, inflation rate, market conditions, state tax policy).
A detailed analysis of the impact on the company’s profitability of all factors without exception will make it possible to increase its level by stimulating product sales, improving production, reducing unnecessary costs and increasing efficiency.
When studying return on assets, you should consider the company's industry. This is due to the fact that capital-intensive industries (for example, railway transport or the energy sector) tend to have lower indicators. The service sector, in turn, characterized by a minimum of working capital with insignificant capital investments, is characterized by increased values of the profitability indicator.
Topic 15.Statistics of current assets
Guidelines for the topic
Current assets are a value advanced in cash, which is in constant circulation and ensures a continuous production process.
Statistics studies the availability of current assets, their movement, structure and turnover.
Average balances of current assets are calculated using the formulas:
1.If the value of current assets at the beginning and end of the year is known:
| , | (129) |
where OAn
and
ОАк
- the cost of fixed assets at the beginning and end of the year, respectively.
If data on the value of current assets is known for unequal periods of time within the period under review, use the arithmetic weighted average formula.
| , | (130) |
where OAi
— the cost of current assets at different points in time;
ti is the length of time during which the value of fixed assets remained unchanged.
If data on the value of fixed assets is known for equal periods of time within the period under consideration, the average chronological formula is used:
| , | (131) |
where OA1. OA2…OAp
– the value of current assets at different points in time;
The efficiency of using current assets is characterized by the following indicators:
Turnover ratio
| or | (132) |
where in
– revenue from sales of products (works, services);
D- income;
— the average value of current assets for the period under review.
Consolidation factor
| or | (133) |
Average duration of one revolution
| (134) |
where tcal
– the total number of days of the reporting period.
4. The acceleration (slowdown) of turnover is determined by the formula:
| (135) |
where and is the average duration of one revolution in the current and previous periods, respectively.
5. The amount of conditionally released (involved) current assets as a result of acceleration (slowdown) of turnover.
| or | (136) |
Problems for practical exercises and independent solutions
Problem 110
Calculate and analyze the turnover indicators of the enterprise’s current assets (in thousand rubles):
| Indicators | Year |
| basic | reporting |
| Revenue from sales of products, works and services - net | |
| Average annual balances of current assets |
You need to calculate:
1. Turnover ratios of current assets, load (consolidation) factors, average duration of one revolution, deviation of the turnover rate (slowdown, acceleration), the amount of conditionally released or additionally involved in the turnover of current assets.
2. Dynamics indicators (absolute growth, growth and growth rates).
3. Formulate conclusions based on the results of the study.
Problem 111
The average balance of current assets of the enterprise in the reporting year decreased by 4.6% and amounted to 480 thousand rubles. with an increase in the average duration of one revolution from 50 to 54 days.
Determine: 1. Revenue from sales of products in the reporting and base periods.
2. The amount of additional funds involved as a result of the slowdown in the turnover of working capital.
Problem 112
| Index | January | February | March | April | May | June | July |
| Working capital balances at the beginning of the month | |||||||
| Revenue from product sales |
Define:
1. Average balances of working capital in each quarter.
2. Indicators of turnover of working capital in each quarter.
3. Indicators of the dynamics of turnover of working capital in the second quarter compared to the first.
4. The amount of working capital released (additionally involved) as a result of acceleration (slowdown) of turnover.
5. Formulate conclusions.
Problem 113
According to the data for the reporting year, the average balance of the enterprise's working capital amounted to 800 thousand rubles, and the cost of products sold for the year amounted to 7200 thousand rubles.
Determine the turnover ratio, the average duration of one revolution and the coefficient of consolidation of working capital.
Problem 114
The following data is available for the enterprise in 2011.
| Indicators | Meaning |
| Cost of products sold, thousand rubles. | |
| Working capital balances, thousand rubles. as of 01/01/2011 as of 04/01/2011 as of 07/01/2011 as of 10/01/2011 as of 01/01/2012 | |
| Number of working capital turnover in 2010 |
Define:
1. How did the number of turnovers and the duration of one turnover of working capital change in 2011 compared to 2010?
2. The amount of working capital released or additionally attracted under the influence of the speed of their circulation.
3. Draw conclusions.
Problem 115
For two industrial enterprises that are part of the concern, the following data is available for two years (million rubles)
| Company | Base year | Reporting year | |
| Cost of products sold | Average working capital balance | Cost of products sold | Average working capital balance |
Determine the change in the average working capital retention ratio and the influence of factors on this change. Explain the economic meaning of the calculated indicators.
Problem 116
Establish what should be the amount of sales revenue for the planned year for the company in order to ensure the release of working capital in the amount of 50 million rubles, if it is known that the turnover rate in the reporting period was 4 turns, and the planned working capital consolidation ratio is 0.2 .
Problem 117
For two industrial enterprises that are part of the concern, the following data is available for two years (million rubles)
| Company | Base year | Reporting year | |
| Cost of products sold | Average balance of current assets | Cost of products sold | Average balance of current assets |
| 12,5 | 3,1 | 13,6 | 3,2 |
| 25,3 | 5,5 |
Determine the change in the average working capital turnover ratio and the influence of factors on this change. Explain the economic meaning of the calculated indicators.
Problem 118
For two industrial enterprises that are part of the concern, the following data is available for two years (million rubles)
| Company | Base year | Reporting year | |
| Cost of products sold | Average balance of current assets | Cost of products sold | Average balance of current assets |
Determine the change in the average working capital retention ratio and the influence of factors on this change. Explain the economic meaning of the calculated indicators.
Problem 119
For two industrial enterprises that are part of the concern, the following data is available for two years (million rubles)
| Indicators | Company A | Company B | |
| According to plan | Actually | According to plan | Actually |
| Sales revenue volume | |||
| Average working capital balance |
Define:
1. Indicators of the use of working capital in comparison with the plan for each company.
2. Establish which of the companies used working capital more efficiently, calculating the amount of released (involved) capital as a result of changes in its turnover.
ROA calculation: why is it needed?
Return on assets ( ROA / return on assets) is an index that characterizes the profitability of an enterprise in the context of its assets, on the basis of which profit is derived. It shows company owners what the return on their investment is.
To understand the economic performance of a business, you need to systematically study the factors that influence the decrease (increase) of profits.
At the same time, the excess of enterprise income over expenses does not mean that business activity is effective. For example, both a large factory, consisting of several production buildings and having multimillion-dollar fixed assets, and a small company of 5 people, located in an office of 30 m2, can earn a million rubles.
If in case 1 one can judge that one is approaching the threshold of unprofitability, then case 2 indicates the receipt of excess profits. This example explains why the key indicator of operational efficiency is not the net profit itself (its absolute value), but the relationship to the different types of costs that create it.
Formula for calculating the indicator
To calculate, you need to find the difference between assets and liabilities. That is, the difference between the company’s property and existing obligations is determined. The assets combine:
- Real estate owned by the structure.
- Land.
- Income from activities.
- Various property, including equipment, tools, furniture, office equipment.
The assets do not include receivables of the founders for contributions to the management company. Liabilities are the company’s debts: short-term and long-term liabilities, various loans, collections. They do not include income from subsequent periods received in connection with state assistance or gratuitous acquisition of property.
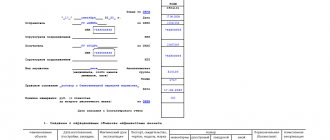
So, the following formula is used for calculation:
(line 1600 – charger) – (line 1400 + line 1500 – DBP)
The formula uses the following definitions:
- ZU – debt of the founders for contributions to the management company.
- DBP – income of the following periods in the form of government assistance or gratuitous acquisition of property.
All relevant lines are taken from the balance sheet.
Analysis of calculation results
There are three net asset values obtained as a result of calculations:
- Negative. Indicates the predominance of liabilities over income. That is, the company's activities are not commercially successful. The organization is completely financially dependent on creditors. She has no own funds.
- Positive. Indicates a positive increase in funds. That is, the company fully covers all its debts and also has its own funds.
- Zero. Indicates that the company is breaking even, but does not bring any profit.
Negative calculation results indicate a high risk of bankruptcy of the organization.
Return on assets ratios
Any company aims to make a profit. What is important is not only its value, but also what was needed to obtain this amount (the amount of work performed, resources involved, expenses incurred).
The comparison of advanced investments and costs with profit is carried out using profitability ratios. They make it possible to determine what increases profitability in the course of business activities or hinders its achievement.
These characteristics are considered the main tools of economic analysis, allowing an accurate assessment of the solvency and investment attractiveness of the company.
In a broad sense, return on assets ratios ( ROA ) reflect the amount of profit received by the organization (in numerical terms) from each monetary unit spent .
That is, the enterprise’s profitability of 42% means that the share of net profit in each ruble earned is 42 kopecks.
The indicators will be carefully studied by credit institutions and investors.
This way, they will be able to understand the possibilities of return on their investments and the associated risks of losing funds.
Business counterparties also rely on these characteristics, determining the level of reliability of the business partnership.
Online net asset value calculation
With this calculator you can determine your net asset value.
There are two calculations presented here.
The first is by order of the Ministry of Finance of the Russian Federation, which is no longer in force (Order of the Ministry of Finance of the Russian Federation N 10n, FCSM of the Russian Federation N 03-6/pz dated January 29, 2003 “On approval of the Procedure for assessing the value of net assets of joint-stock companies” (Registered with the Ministry of Justice of the Russian Federation on March 12, 2003 N 4252)). So it's just for reference.
The second is according to the currently valid (in 2021) order of the Ministry of Finance (Order of the Ministry of Finance of Russia dated August 28, 2014 N 84n “On approval of the Procedure for determining the value of net assets” (Registered with the Ministry of Justice of Russia on October 14, 2014 N 34299))
To make the calculation, you only need to enter your balance data.
Conclusions from the analysis are based on the identified problems: examples of problems identified during the analysis.
Examples of activities to eliminate identified problems: examples of activities for WRC.
You can draw conclusions on financial analysis yourself, or order them on any exchange for students.
To estimate the cost, you can leave a request on the exchange. If no one approaches, just delete the application and that’s it.
Link to the most popular exchange (author24): https://avtor24.ru/.
Detailed instructions are here: how to order work on the stock exchange
Please read the article on how to save your analysis before entering data: Saving financial analysis results to your computer
If the table does not fit, open it in a new window: net assets of the enterprise
The financial analysis:
- II. CURRENT ASSETS Current assets are property used in the activities of an enterprise for less than a year or used in one production cycle, which also does not exceed one year. Its entire cost...
- III. CAPITAL AND RESERVES Section III Capital and Reserves is the third section of the balance sheet. But what is more important is the first section of financial sources, that is, the liability side of the balance sheet. By this he...
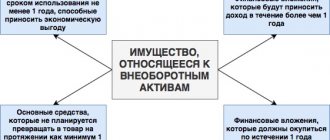
- I. NON-CURRENT ASSETS Non-current assets are property used in the activities of an enterprise for more than a year. Its value is transferred in parts to the cost of finished products. A sign of assets is the ability to generate income for the organization.…
- Analysis of the financial condition and performance of the bank online for free Hello, dear visitor. This service is the next update of the service for analyzing bank financial indicators for 2021 and later - until new changes appear. On the…
- Analysis of the financial condition of the enterprise Hello. This page contains an updated service for free analysis of the financial condition of an enterprise online. In 2019-2020, some lines in the income statement changed, so...
- Financial analysis of budgetary organizations online for free: state (municipal) institutions and... This is a new free analysis service taking into account changes in reporting for 2021 and beyond. For earlier reporting, the analysis is here: analysis of data from a budgetary organization...
- Analysis of enterprise bankruptcy Hello, my dear reader. This service allows you to analyze the bankruptcy of an enterprise using a number of popular bankruptcy risk assessment models, as well as using some indicators from regulatory…
- Absolute economic indicators of an enterprise's activity Absolute economic indicators of an enterprise's activity are indicators that allow us to judge several things: The size of the enterprise and the scale of its activities The level of income and expenses...
- V. CURRENT LIABILITIES Section V. Current liabilities is the fifth section of the balance sheet. At the same time, it is also the third section of the liability side of the balance sheet, which shows the sources of financing for the property. AND…
- Key performance indicators of an enterprise Key performance indicators of an enterprise are indicators that allow us to judge several things: The size of the enterprise and the scale of its activities The level of income and expenses About ...
Return on assets formulas:
Economic
The general formula used to calculate return on assets is:
Formula: Return on assets = (net profit / average annual assets) * 100%
To calculate the value, the following are taken from the financial statements:
- net profit from f. No. 2 “Report on financial results";
- average value of assets from f. No. 1 “Balance” (an exact calculation can be obtained by adding the amounts of assets at the beginning and end of the reporting period, the resulting number is divided in half).
Familiarize yourself with the meanings of the terms in the basic formulas:
- Revenue is the amount of money that was received from the sale of products, investments, sales of goods (services) or securities, lending and other transactions as a result of commercial activities.
- Profit from sales represents the so-called income before taxes, that is, the difference between the amount of revenue and the amount of operating costs.
- Production costs are the sum of the cost of working capital and fixed assets.
- Net profit is actually the difference between revenue received during operating activities and the company's total costs for the reporting period, taking into account expenses intended to pay taxes.
Assets represent the total value of a company's:
- property (buildings, machinery, structures, equipment);
- cash (securities, cash, bank deposits); accounts receivable;
- material reserves;
- copyrights and patents;
- fixed assets.
Net assets represent the so-called difference between the value of total assets and liabilities (the amount of debt) of the company. The calculations use the total value of section 3 f. No. 1 “Balance”.
Note that international accounting is oversaturated with methods for calculating profitability. Without going into the essence of the values, domestic economists have adopted most of the indicators used in Western practice.
This became a source of problems in calculations due to distortions in the concepts: “income”, “profit”, “expenses”, “revenue”. For example, according to the GAAP system, there are up to 20 types of profit!
Although the name of a particular indicator used in financial reporting in Russia is identical to the name of the indicator according to international standards, their meaning can be interpreted differently. So, depreciation charges are deducted from gross profit, but according to Western standards they are not .
Mechanically copying profitability ratios and terms from international standards into Russian practice is, at a minimum, incorrect. At the same time, pre-market approaches are retained when calculating indicators.
Coefficient
Return on assets ratio. In economic terminology, ROA is a coefficient equal to the balance sheet profit from sales of products (services) minus the cost of capital (average annual) invested as a whole.
Thus, ROA shows the average profitability of a company on its total sources of capital. This allows us to judge the management’s ability to rationally use the company’s assets in order to extract maximum profit.
Formula: Return on assets ratio = the ratio of the amount of net profit and interest payments multiplied by (1 - current tax rate) to the assets of the enterprise multiplied by 100%
As you can see, when calculating
ROA , net profit is adjusted by the amount of interest intended for loan payments (income tax is also taken into account).
It is worth noting that some financiers use EBIT (earnings before interest and taxes) as the numerator of the ratio.
With this approach, companies using debt capital turn out to be less profitable. At the same time, the efficiency of their commercial activities is often higher than that of companies whose financing is actually carried out from their own capital.
When calculating ROA , it is better to use figures from the annual report. Otherwise (if quarterly indicators are taken as a basis), the coefficient must be multiplied by the number of reporting periods.
By balance
The return on total assets on the balance sheet is calculated in percentage terms as the ratio of net profit (net of taxation) to assets (excluding shares purchased from shareholders and debts of company owners for founders' contributions to the authorized capital).
Formula: Return on assets on the balance sheet = net profit for the reporting period (loss) * (360 / period) * (1 / balance sheet currency)
For calculations based on the Balance Sheet for medium-sized and large companies, it is necessary to calculate the arithmetic average of the values in the document itself:
- VnАср – cost of non-current assets (annual average) – page 190 (“Total” in Section I)
- ObАср – cost of current assets (average annual) – page 290 (“Total” in Section II) For small enterprises, the corresponding indicators are calculated differently:
- VnАср - the value of non-current assets is equal to the sum of line 1150 and line 1170;
- ObAsr - the value of current assets is equal to the sum of line 1210, line 1250 and line 1230.
To get average annual values, you need to add up the numbers at the beginning and end of the reporting period. Profitability is calculated using the basic formula. In this case, the values of ObAsp and InAsp are summed up. If you need to calculate the profitability of current (non-current) assets separately, the following formulas are used:
- ROAvn = PR / InAsr;
- ROAob=PR / ObAcr; where PR is profit.
Net assets
The net assets of an enterprise are the book value minus debt obligations. If the indicator has a “–” sign, we can talk about insufficient property when the amount of the company’s debts is higher than the value of its property as a whole.
If they are less than the amount of the authorized capital at the end of the year, the company needs to reduce its size by equalizing the indicators (however, not lower than the amount established by the Law, otherwise the company may be liquidated for this reason).
Joint-stock companies have the right to make decisions regarding the payment of dividends if the value of net assets is not lower than the size of the authorized capital (as well as reserve capital) in the amount of the difference between the value (par and liquidation) of preferred shares.
Net assets are necessarily calculated based on balance sheet data. But at the same time, future income, as well as reserves, are not included in liabilities.
Formula: Net profitability ratio = net profit / revenue from sales of products (services)
This indicator shows the profitability of the enterprise based on the rate of net profit per 1 monetary unit (currency) of products sold. By the way, it correlates with the company’s accounting profitability ratio.
Current assets
Shows what, in percentage terms, is the amount of profit received by the company from one unit of current assets. The indicator is calculated as follows:
Formula: Return on current assets = net profit for the reporting period (loss) * (360 / period) * (1 / current assets)
Average assets on balance sheet
To calculate the average value of assets on the balance sheet, the following formula is used:
Asg = (s. 1600ng + s. 1600 kg) / 2.
Where:
- C. 1600 ng – the amount on line 1600 at the end of December of the previous year;
- C. 1600kg - the amount on line 1600 at the end of December of the current year.
Also, using the balance sheet, you can calculate the average size of individual types and groups of assets. For example, the average size of current assets.
Similar articles
- Current assets
- Asset turnover ratio
- Book value of assets
- Return on Assets: Formula
- Asset coverage ratio