The Federal Tax Service has posted on its website new values of profitability and tax burden, which are taken into account when planning on-site inspections. These indicators are calculated based on data for 2021 by type of economic activity.
In recent years, the Tax Service has been placing emphasis on preliminary analytical work when planning audits. The goal is to conduct fewer visits and inspect only entities that have a high likelihood of detecting violations. As a result, inspections became more effective. This means that if a company is included in the plan, the likelihood of additional charges is extremely high.
When planning audits, tax officials rely on the approved concept (order dated May 30, 2007 No. MM-3-06/ [email protected] ). There are 12 key criteria by which the Federal Tax Service carries out monitoring. If the company's relevant indicators fall outside the established norms, the Tax Service pays attention to this. When there are several such deviations, the chances of meeting the on-site inspection plan increase.
Of course, failure to meet these criteria does not automatically mean that an on-site inspection is coming. Pre-test analysis is a serious job that uses a lot more data. However, for self-audit, the Tax Service recommends that taxpayers keep their finger on the pulse and always monitor the criteria from the above order. Among them are two indicators for which the Federal Tax Service recently updated data. They are calculated based on the results of 2021 based on information available in the Federal Tax Service itself, as well as at the disposal of Rosstat.
Answer
The main indicator of the company, which is closely monitored by controllers, is the tax burden. That is, the auditors want to know what share of your income you give to the state. They themselves explain that it is necessary to correlate the amount of taxes paid with revenue using the formula: Amount of taxes paid during the year: Amount of revenue for the year (excluding VAT) * 100%. Safe indicators of the tax burden and profitability for 2012 for common types of activities are sent to you in the response materials.
The rationale for this position is given below in the materials of the Glavbukh System version for commercial organizations
1. Article: How to calculate the tax burden and profitability to find out whether to wait for an audit
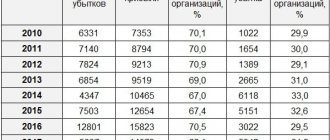
Tax officials, when selecting candidates for an on-site audit, use the criteria listed in Appendix No. 2 to the order of the Federal Tax Service of Russia dated May 30, 2007 No. MM-3-06 / [email protected] Among them are indicators of the tax burden and profitability. Every year, industry average values for them are updated on the website of the Federal Tax Service of Russia in the “Control work” section. We also provided data on profitability and tax burden for 2012 in the table below.
Safe indicators of tax burden and profitability for 2012 for common types of activities*
Type of economic activity
The tax burden, %
Return on assets, %
Return on sales, %
Agriculture, hunting and forestry
Load indicators
So, to accurately determine the need for a tax audit, auditors use indicators of tax burden and profitability.
Let us remind you that when planning on-site inspections, inspectors apply 12 criteria. All of them are given in the order of the Federal Tax Service dated May 30, 2007 No. MM-3-06 / [email protected] A taxpayer who meets the criteria will most likely be included in the plan of on-site tax audits. Some criteria have numerical indicators that are updated annually. In particular, these include the tax burden (criterion No. 1) and the level of business profitability (criterion No. 11).
Auditors do not keep secret the indicators they use to decide whether to initiate an audit. Therefore, companies can independently assess the risks of their meeting with controllers.
A taxpayer may be included in the on-site audit plan if its tax burden is below the average level for business entities in a particular industry. The load is calculated using the formula:
| the amount of taxes and fees for the calendar year according to reporting data | ÷ | turnover of organizations (according to Rosstat) | × | 100 % |
Based on the calculation formula, the tax burden is closest in meaning to the concept of “tax burden”. The “Modern Economic Dictionary” (M.: INFRA-M, 2011) gives two meanings to the latter, defining it as the degree of diversion of funds to pay tax payments, i.e., as a relative value, and the burden arising from the obligation to pay taxes, i.e. i.e. as an absolute value.
The first of these values is more interesting for evaluative and comparative analysis; it corresponds to the idea of the algorithm for calculating the tax burden contained in the above-mentioned documents of the Federal Tax Service of Russia.
Thus, the load is the share of the amount of taxes paid for a certain period in any economic base for the same period, which allows us to assess the impact of the amount of tax payments on the profitability and profitability of the subject being assessed. The tax burden can be calculated at different economic levels:
- for the state as a whole or for its regions,
- by economic sectors of the country or regions,
- for a group of similar enterprises,
- for individual business entities,
- for a specific person.
Depending on the economic level and the purpose of calculating this indicator, its base may be, for example, revenue (with or without VAT), income, source of tax payment (profit or costs), newly created value, expected income or planned profit.
As a calculated indicator, the tax burden echoes the concept of the effective tax rate, which is a percentage of the actually accrued tax in the base for this tax. In letters of the Federal Tax Service dated July 17, 2013 No. AS-4-2/12722 and dated July 25, 2021 No. ED-4-15 / [email protected] this concept is defined as the tax burden for the corresponding tax.
Profitability of agribusiness
In the first and third quarters of 2021, profitability in the field of crop production decreased compared to last year, while in the field of livestock production, on the contrary, it increased
According to Rosstat, in the first and third quarters of 2021, the level of profitability (estimated as the ratio of the balanced financial result to the cost of products sold) in crop farming was 24%, and in livestock farming – 15%. This profitability ratio between crop production and livestock production has been observed before. However, over the past year, profitability in crop production has decreased significantly (by 12 percentage points compared to the first and third quarters of 2021), while in livestock farming, on the contrary, it has increased (by 5 percentage points) (see Fig. 1 and 2 ).
Agribusiness profitability indicators differ significantly among Russian regions. Thus, profitability in crop production in the first and third quarters of 2021 ranged from 3% in the Far Eastern Federal District to 36% in the Southern Federal District. The highest level of profitability in crop production was achieved in the Yaroslavl region (78%) and Trans-Baikal Territory (54%). At the same time, the level of profitability of livestock farming varied from -17% (Far Eastern Federal District) to 19% (Central Federal District), and the highest rates were recorded in the Kursk region (46%) and the Pskov region (35%).
Profitability of crop production
Production costs for agricultural producers are also increasing. According to Rosstat, in October 2021, prices for gasoline increased by 11.9% in annual terms, for fuel - by 14-15%, for many mineral fertilizers - by 15-20% (see table).
The most attractive for grain producers now are export supplies. But despite the fact that grain supplies to foreign markets are growing at a fairly high rate (about 30% in annual terms), their further expansion is hampered by high port congestion and a shortage of wagons for grain export. The transportation of grain itself is also quite expensive. Despite the fact that Russian Railways has established a discount of 10.3% on grain export transportation from the Voronezh, Oryol, Tambov, Orenburg and other regions from October 2021, and from November 2021 additional subsidies for the costs of export rail transportation have been approved through the REC, in reality these support measures will become available to agricultural producers only next year, since most of them have transportation contracts valid until the end of 2021.
Under the current conditions, in the first and third quarters of 2021, the most profitable segments of agriculture turned out to be the cultivation of corn and oilseeds, as well as the cultivation of pome and stone fruit crops, where the average profitability level in Russia exceeded 33% (see Fig. 3).
Overall, the current decline in sales margins in crop production may lead to a reduction in production next year. According to the Ministry of Agriculture, as of December 13, 2021, the growth rate of winter sowing was already 1.7% less than last year.
Profitability of livestock farming
The observed increase in the profitability of livestock products is associated with a decrease in the costs of agricultural producers for feed crops, as well as with the expansion of opportunities for purchasing imported equipment, feed, additives, etc.
The most favorable situation with profitability of sales has developed this year among meat producers. On the one hand, a high grain harvest ensured low prices for feed components. On the other hand, the appreciation of the ruble compared to last year brought benefits to producers who are significantly dependent on imports of equipment, machinery, feed components and additives. According to Rosstat, the highest level of profitability in livestock farming on average in Russia is typical for raising pigs for meat (25%), as well as in poultry farming (9%) (see Figure 3). It is important to note that high profitability in this area is usually observed among large manufacturers, while small and medium-sized manufacturers have low, and in some cases negative, return on sales.
Profitability in the food industry
In the first and third quarters of 2021, the return on sales in the food industry was 8%. At the same time, the most profitable segments of the food industry were the production of flour confectionery products, where the profitability indicator reached 32%, as well as the production of baby food and dietary foods (21%) (see Fig. 4).
It is also worth noting that this year the profitability of sugar production fell by more than 3 times - from 18.9% in three quarters of 2016 to 6% in the first and third quarters of 2021. This reduction was caused by overproduction of sugar and a corresponding drop in prices both domestically and in international markets.
Profitability assessment
A rise or fall in an indicator indicates various economic phenomena.
If profitability increases:
- An increase in revenue occurs more quickly than an increase in costs (either sales volumes have increased or the assortment has changed).
- Costs are decreasing faster than revenue is decreasing (the company has either raised product prices or changed the assortment structure).
- Revenue grows, but costs become lower (prices have increased, the assortment has changed, or cost standards have changed).
The first two situations are definitely favorable for the company. Further analysis is aimed at assessing the sustainability of this situation.
The second situation for the company cannot be called unambiguously favorable. After all, the profitability indicator has formally improved (revenue has decreased). To make decisions, pricing and assortment are analyzed.
If profitability has decreased:
- Costs grow faster than revenue (due to inflation, lower prices, increased cost standards, or changes in product mix).
- The decline in revenue occurs faster than the reduction in costs (sales have fallen).
- Revenue becomes less, and costs increase (cost rates have increased, prices have decreased, or the assortment has changed).
The first trend is clearly unfavorable. Additional analysis of the reasons is needed to correct the situation. The second situation indicates the company's desire to reduce its sphere of influence in the market. If a third trend is detected, pricing, assortment, and cost control systems need to be analyzed.
How to Calculate Return on Sales in Excel
The international designation of the indicator is ROS. The return on sales ratio is always calculated based on sales profit.
ROS = (profit/revenue) * 100%.
In specific situations, it may be necessary to calculate the share of gross, book or other profit in revenue.
Formula for gross return on sales (margin):
(Gross profit / sales revenue) * 100%.
This indicator shows the level of “dirty” money (before all deductions) earned by the company from the sale of products. The elements of the formula are taken in monetary terms. Gross profit and revenue can be found on the income statement.
Information for calculation:
In the cells for calculating gross profitability, we will set the percentage format. Enter the formula:
The gross profit margin indicator for 3 years is relatively stable. This means that the company carefully monitors pricing procedures and monitors the product range.
Operating profit margin (EBIT):
(Operating profit / sales revenue) * 100%.
The indicator characterizes how much operating profit is per ruble of revenue.
How to calculate the return on sales ratio - balance sheet formula (form 2):
((Page 2300 + Page 2330) / Page 2110) * 100%.
Data for calculation:
Let's calculate the profitability of operating profit - substitute references to the required cells into the formula:
Formula for return on sales based on net profit:
(Net profit / revenue) * 100%.
Net profitability shows how much net profit is per ruble of revenue. Both figures are taken from the income statement.
Let's show the return on sales ratio on the graph:
In 2015, the indicator decreased significantly, which is regarded as an unfavorable phenomenon. Additional analysis of the assortment list, pricing and cost control system is required.
A value above zero is considered normal. The more specific range depends on the field of activity. Each enterprise compares its return on sales ratio and the standard value for the industry. It’s good if the calculated indicator practically does not differ from the inflation rate.
| Home » For entrepreneurs » Average profitability by industry 2017 |
Profitability calculation
Of the huge number of types of profitability of companies or, in other words, the efficiency of their work, tax authorities are interested in two types:
- profitability of goods sales,
- profitability of assets.
O is nothing more than a figure of speech. Tax authorities understand goods as services, works, and even rent.
The profitability formula for any type is always a ratio. When calculating the profitability of these two types, tax authorities use:
- the denominator is the financial result;
- in the numerator - accounting data reflecting the cost of sales or the value of assets, respectively.
However, it is necessary to focus not on average indicators, but on the type of activity (OKVED 2), which is indicated in the balance sheet.
Average profitability by industry 2021
Return to Profitability 2017
The Federal Tax Service publishes average profitability indicators on its official website.
So, today the current figures are the following values:
— wholesale trade – 10.5% — retail trade – 3.6% — construction – 6.7%
Profitability indicators by industry should be taken into account when assessing the risk of a tax audit of your organization. When conducting on-site tax control, inspectors quite often pay attention specifically to the organization’s profitability statistics, so this criterion can also be used by taxpayers who want to adjust the results of their financial and economic activities in order to reduce the risk of coming to the attention of tax inspectors. A significant deviation is considered to be profitability that differs by more than 10% from the indicators of similar industries and organizations.
We should also not forget about such a criterion as a relatively low tax burden, which is noticeably lower than the average level for all business entities in a certain industry.
This can also attract increased attention from tax authorities.
Average profitability
When calculating profitability, you need to obtain two important accounting indicators: return on assets and return on sales. Then the obtained figures must be compared with the average level of profitability for your type of activity (main). Industry profitability is always indicated in special directories that are regularly published by Rosstat.
To calculate the profitability of sales, it is necessary to take the ratio of the balanced financial result from sales to the cost of products sold (x100%).
Experts consider the following to be significant factors influencing the amount of profitability:
— change in the cost of raw materials; — level of qualification of the workforce; — the markup is too small or large; — presence or absence of discounts; — influence of competition, etc.
Average profitability and tax burden
Many are familiar with the concept of assessing the risk of a tax audit, as well as the dependence of the magnitude of this risk on factors such as the size of the tax burden, almost equal amounts of income and expenses of the organization, or payment of salaries, the size of which is below the national average. Among these factors is the profitability indicator in the enterprise statistics. It is no secret that if it seriously deviates from the level of profitability calculated by the Ministry of Finance for a given area of activity, this will inevitably entail an inspection by the Federal Tax Service.
Profitability by type of activity
The Federal Tax Service publishes average profitability indicators on its official website.
So, today the current figures are the following values:
— wholesale trade – 10.5% — retail trade – 3.6% — construction – 6.7%
Profitability indicators by industry should be taken into account when assessing the risk of a tax audit of your organization. When conducting on-site tax control, inspectors quite often pay attention specifically to the organization’s profitability statistics, so this criterion can also be used by taxpayers who want to adjust the results of their financial and economic activities in order to reduce the risk of coming to the attention of tax inspectors. A significant deviation is considered to be profitability that differs by more than 10% from the indicators of similar industries and organizations.
We should also not forget about such a criterion as a relatively low tax burden, which is noticeably lower than the average level for all business entities in a certain industry. This can also attract increased attention from tax authorities.
Tax burden on taxes: calculation examples
Example 1
Trio LLC is a construction company based on OSNO. Revenue excluding VAT for 2019 according to line 2110 of the Financial Results Report (Report on Financial Results) amounted to 12 million rubles. According to tax reporting for 2021, the company calculated the following taxes for payment:
- VAT – 400,000 rub. (the amount of tax payable is taken into account, i.e. the difference between accrued and refunded VAT);
- NNP (income tax) – 750,000 rubles;
- Personal income tax – 290,000 rubles;
- property tax – 65,000 rubles;
- transport tax – 32,000 rubles.
The average tax burden for the construction industry is 11.9%. Let's calculate NN and compare it with the average value:
NN = (400000 + 750000 + 290000 + 65000 + 32000) / 12000000 x 100 = 12.81%
12.81>11.9%, i.e. The company's tax burden for the past year is above the industry average, therefore, the risk of assigning an on-site audit can be eliminated.
Example 2
Leto LLC is engaged in electricity supply. Let's calculate the tax burden based on the data:
- revenue without excise taxes and VAT – 58 million rubles.
- VAT payable – 1 million rubles.
- NNP – 2 million rubles.
- Personal income tax – 300 thousand rubles.
- property tax – 100 thousand rubles.
- transport tax – 100 thousand rubles.
NN = (1000000 + 2000000 + 300000 + 100000 + 100000) / 58000000 x 100 = 6.03%
The industry average is 8.3%; a low load will attract the attention of the Federal Tax Service. An enterprise should quickly monitor this index, increasing it, for example, by increasing production volumes.
As a rule, the Federal Tax Service does not immediately come out for an inspection, first asking for clarification from the manager. Motivated explanations of why the load is below average may satisfy tax officials. If the Federal Tax Service is not satisfied with either the tax identification indicator or the explanation, then the enterprise may become the subject of an on-site inspection.
What percentage of return is considered acceptable?
Average profitability
When calculating profitability, you need to obtain two important accounting indicators: return on assets and return on sales. Then the obtained figures must be compared with the average level of profitability for your type of activity (main). Industry profitability is always indicated in special directories that are regularly published by Rosstat.
To calculate the profitability of sales, it is necessary to take the ratio of the balanced financial result from sales to the cost of products sold (x100%).
Experts consider the following to be significant factors influencing the amount of profitability:
— change in the cost of raw materials; — level of qualification of the workforce; — the markup is too small or large; — presence or absence of discounts; — influence of competition, etc.
The Federal Tax Service published average profitability and tax burden indicators
A significant deviation from the level of profitability established for a specific area of activity will attract attention from the Federal Tax Service.
The Federal Tax Service published average profitability indicators for goods, products, works, services and assets sold by organizations by type of economic activity.
As can be seen from the presented material, the areas of activity in which there was a decrease in the level of profitability for 2021 (compared to 2021) are as follows:
– wholesale trade; – production of electrical equipment; – production of vehicles.
Spheres such as construction and transport remained at the same level (a small percentage decrease in profitability).
Please note that a significant deviation of the level of profitability from statistical indicators (established for specific types of activities) will attract attention from regulatory authorities. Tax authorities take into account the deviation of the level of profitability according to the company (accounting data) from the industry average of no more than 10%.
Similar conclusions can be drawn about the impact of the tax burden on the ratio, since an increase in taxes (except for indirect ones in cases where the burden of the tax burden is shifted to buyers) leads to a decrease in both net profit and assets of the enterprise, and the return on assets ratio decreases with growth taxes are similar to the return on equity ratio (except for the increase in indirect taxes passed on to buyers).
It should be noted that the size of the tax burden does not affect the volume of sales (i.e., the denominator of the coefficient), therefore, the result of an increase in taxes is a decrease in net profit (i.e., the numerator of the coefficient) and a decrease in the profitability ratio of sales.
Thus, an increase in the tax burden, leading to an increase in government revenues, causes a decrease in such important indicators of the financial stability of a commercial organization as various profitability ratios (with the exception of cases of growth in indirect taxes, which are reimbursed by buyers and in this case have virtually no effect on the profitability of enterprises).
Calculation of prices based on profitability standards
⇐ Previous1234567
Profitability is the ability of allocated or invested capital to generate income, expressed in financial measurements.
The basic ratio of enterprise profitability is as follows: profit/capital. The cost-benefit ratio is the rate used to determine the amount of specific profit in price (set as a percentage of the unit cost of production).
There are the following types of profitability standards:
• a single rate in relation to the total cost;
• a single rate in relation to direct (variable) costs, most often the sum of the basic salary and the cost of raw materials (for material-intensive or labor-intensive production);
• a two-element standard, determined based on the need to ensure the return on investment required by the company. The first element of the standard in this case is determined as a percentage of the cost of the materials used for production and is intended to ensure the necessary return on investment in creating reserves of these materials. The second element of the standard is determined as a percentage of the sum of wage costs and overhead costs and must ensure an appropriate level of investment in physical (real) assets (fixed assets);
• a multi-rate system is defined as the sum of two elements: a) a standard in relation to the amount of wages; b) standard in relation to the cost of raw materials and materials. Then the standard determined in this way is differentiated depending on the volume of products supplied.
The choice of standard is determined by the complexity of accounting for various types of costs, volume and conditions of attracted investments, etc.
The general formula by which the price will be set taking into account profitability:
where P is the product price;
TC – gross production costs;
R – profitability standard.
Return on equity will depend on two components: profit and capital. Return on equity is the ratio of a firm's gross profit to the value of its assets.
Accordingly, the amount of profitability will depend on asset turnover and profitability (profitability of sales).
Asset turnover is an indicator characterizing how many times the value of a company's assets was reproduced in sales revenue, that is, the revenue multiple of the value of assets or the productivity of assets (the efficiency of their use). Determined by the ratio of sales revenue to the total value of assets:
where SR is asset turnover;
TR – revenue from products sold in the planning period;
TA is the average amount of assets used (that is, how much sales revenue is received for each ruble of assets).
Sales profitability (profitability) indicator - represents the share of gross profit in total revenue and is defined as “the sum of gross profit to sales revenue:
where РМ – profitability of sales;
TR – sales revenue;
TC – total costs.
The product of asset turnover and return on sales gives the actual return on equity.
Since most often there is a need to obtain a given profit margin (or rate of return), the return on sales formula can be written as
where PR is the rate of return on invested capital (%);
TA – total value of assets (balance sheet);
TR – sales revenue. The general formula for the total cost of a costing unit of production:
where M is the cost of materials and semi-finished products, taking into account the cost of returnable waste;
Sk – costs of process fuel and process energy;
Sz – basic salary;
kq – coefficient of additional wages; ks – coefficient of deductions for social needs;
Sco – costs of maintenance and operation of technological equipment;
K01 K0 – coefficients of shop and overhead costs;
Sk – expenses for the preparation and development of new structures;
Sb – costs associated with marriage;
Sn – other production costs;
kv – coefficient of non-production expenses.
There are technological, workshop, production and full commercial costs.
The technological cost of a product is part of its cost, determined by the amount of costs for implementing the technological processes of manufacturing the product. It includes all direct costs and expenses associated with the maintenance and operation of the technological equipment with which products are manufactured.
Shop cost includes shop costs for production, that is, technological cost and shop costs.
Production costs, in addition to shop costs, include general production costs, losses from defects, costs of developing production and preparing for production. The total cost includes production costs and non-production costs.
Determination of profit taking into account cost
The main part of gross profit is profit from sales of products. You can plan it in two ways:
• direct counting method;
• calculation and analytical method.
Using the direct counting method, profit is determined as the difference between the volume of products sold in value terms and the total amount of production costs for their production and sale (full cost of products sold):
where π is profit from the sale of commercial products;
q – quantity of products sold;
p – product price;
S – total cost of one product;
n – nomenclature of commercial products. This calculation method is simple, but it is difficult to apply when there is a large range of output. In addition, it does not allow us to trace the impact on profit of various factors (changes in prices, output volumes, costs, etc.). Therefore, the analytical method of calculating profit is also used. This method is based on the profitability of production in the reporting period and the growth of corresponding indicators in the planning period.
Example. In the reporting year, product sales amounted to: at wholesale prices - 140 thousand rubles, at cost - 120 thousand.
Return on sales by industry (type of activity)
| Averaging method: | ||||||
| Kind of activity | Year | |||||
| 2012 | 2013 | 2014 | 2015 | 2016 | 2017 | |
| All industries of the Russian Federation | 2,4% | 3,9% | 3,8% | 3,9% | 4% | 4,3% |
| 01. Crop and livestock farming, hunting and provision of related services in these areas | 4,8% | 5,3% | 7,7% | 10,4% | 9,7% | 8% |
| 02. Forestry and logging | 0,6% | 4,1% | 5% | 5,1% | 5,4% | 6,1% |
| 03. Fishing and fish farming | 7% | 9,6% | 10,4% | 13,3% | 13,4% | 12,2% |
| 05. Coal mining | 3,5% | 1,6% | 3,7% | 4,1% | 5,5% | 8,1% |
| 06. Crude oil and natural gas production | 13% | 11,2% | 9,8% | 9,6% | 8,3% | 7,3% |
| 07. Mining of metal ores | 13,3% | 4,3% | 4,9% | 6,9% | 8,1% | 11,6% |
| 08. Mining of other minerals | 5% | 3,6% | 3,6% | 3,6% | 3,8% | 4,4% |
| 09. Provision of services in the field of mining | 4% | 4,3% | 4,6% | 4,2% | 4,5% | 4,2% |
| 10. Food production | 3,1% | 3,8% | 3,8% | 3,8% | 3,7% | 3,9% |
| 11. Beverage production | 5,5% | 5,8% | 5,1% | 5% | 4,8% | 5,2% |
| 12. Production of tobacco products | 11,2% | 8% | 16,2% | 7,5% | 7,5% | 7,7% |
| 13. Production of textiles | 2,8% | 4,1% | 3,9% | 4,3% | 4,3% | 4,5% |
| 14. Clothing production | 3,1% | 5% | 4,7% | 5,2% | 5,6% | 5,6% |
| 15. Production of leather and leather products | 3,3% | 4,4% | 4,2% | 4,6% | 5% | 5,3% |
| 16. Wood processing and production of wood and cork products, except furniture, production of straw products and weaving materials | 1,7% | 4,1% | 4,3% | 4% | 4,2% | 4,5% |
| 17. Production of paper and paper products | 4,3% | 2,7% | 3,3% | 3,5% | 3,2% | 3,2% |
| 18. Printing activities and copying of information media | 2,1% | 3,9% | 3,5% | 3,9% | 4,1% | 4,3% |
| 19. Production of coke and petroleum products | 3,4% | 3,3% | 2,9% | 3,8% | 3,6% | 4,9% |
| 20. Production of chemicals and chemical products | 4,2% | 4,1% | 4,1% | 4,4% | 4,4% | 4,7% |
| 21. Production of medicines and materials used for medical purposes | 8,5% | 6,8% | 6,9% | 7,8% | 7,8% | 8,2% |
| 22. Production of rubber and plastic products | 3,4% | 3,5% | 3,1% | 3,2% | 3,3% | 3,4% |
| 23. Production of other non-metallic mineral products | 3,8% | 3,5% | 3,2% | 2,9% | 2,7% | 2,7% |
| 24. Metallurgical production | 3% | 2,7% | 2,8% | 2,9% | 3% | 2,7% |
| 25. Production of finished metal products, except machinery and equipment | 3,6% | 3,3% | 3% | 3% | 3,3% | 3,4% |
| 26. Production of computers, electronic and optical products | 6,4% | 5,9% | 5,4% | 5,7% | 5,9% | 7% |
| 27. Production of electrical equipment | 4,1% | 3,5% | 3,2% | 3,4% | 3,6% | 4% |
| 28. Production of machinery and equipment not included in other groups | 4% | 3,5% | 3,1% | 3,3% | 3,3% | 3,8% |
| 29. Production of motor vehicles, trailers and semi-trailers | 3,5% | 3,1% | 2,3% | 2,5% | 3% | 3,5% |
| 30. Production of other vehicles and equipment | 4,7% | 3,6% | 2,8% | 4% | 4,1% | 4,8% |
| 31. Furniture production | 2,7% | 4,7% | 4,3% | 4,4% | 4,5% | 4,5% |
| 32. Production of other finished products | 4,4% | 6% | 5,7% | 6,2% | 6% | 6,3% |
| 33. Repair and installation of machinery and equipment | 3,5% | 5,6% | 5,3% | 5,7% | 6% | 6,3% |
| 35. Providing electricity, gas and steam; air conditioning | 0,7% | 1,7% | 1,8% | 1,9% | 2,5% | 2,4% |
| 36. Water intake, purification and distribution | -0,6% | 0% | 0,1% | 0% | 0,1% | 0,4% |
| 37. Wastewater collection and treatment | -0,9% | 2,7% | 3,5% | 4,3% | 4,6% | 4,9% |
| 38. Collection, processing and disposal of waste; processing of secondary raw materials | 1,1% | 2,9% | 3,1% | 2,9% | 3,2% | 3,8% |
| 39. Provision of services in the field of cleanup and other services related to waste disposal | 1,1% | 6,2% | 5,1% | 4,5% | 4,3% | 4,5% |
| 41. Construction of buildings | 1,7% | 2,5% | 2,4% | 2,3% | 2,4% | 2,8% |
| 42. Construction of engineering structures | 2,2% | 3,4% | 3,2% | 3,1% | 3,3% | 3,4% |
| 43. Specialized construction work | 2,2% | 3,8% | 3,5% | 3,6% | 3,7% | 4% |
| 45. Wholesale and retail trade in motor vehicles and motorcycles and their repair | 1,8% | 3% | 2,9% | 3,2% | 3,2% | 3,2% |
| 46. Wholesale trade, except for wholesale trade of motor vehicles and motorcycles | 1,5% | 1,9% | 1,9% | 2% | 2,1% | 2,4% |
| 47. Retail trade, except trade in motor vehicles and motorcycles | 2,1% | 4,8% | 4,5% | 4,6% | 4,5% | 4,5% |
| 49. Activities of land and pipeline transport | 0,8% | 2,6% | 2,4% | 2,3% | 2,4% | 2,6% |
| 50. Water transport activities | 1,6% | 3,5% | 3,3% | 3,5% | 3,3% | 4% |
| 51. Activities of air and space transport | 1,6% | 2,6% | 2,7% | 2,3% | 1,7% | 3,3% |
| 52. Warehousing and auxiliary transport activities | 2,6% | 3% | 2,6% | 2,4% | 2,4% | 3% |
| 53. Postal and courier activities | 4,1% | 5% | 5% | 5,5% | 4,5% | 5,5% |
| 55. Activities to provide places for temporary residence | 4,3% | 7,1% | 6,2% | 6,1% | 6,7% | 6,9% |
| 56. Activities for the provision of food and beverages | 2,1% | 6,1% | 5,4% | 5,5% | 5,9% | 6,7% |
| 58. Publishing activities | 1,2% | 5% | 4,4% | 4,8% | 4,9% | 5,4% |
| 59. Production of films, videos and television programs, publication of sound recordings and notes | 1,7% | 3,7% | 3,3% | 3,6% | 4,3% | 5% |
| 60. Activities in the field of television and radio broadcasting | 6,1% | 6,8% | 5,5% | 5,2% | 5,7% | 6,4% |
| 61. Activities in the field of telecommunications | 4,7% | 6,1% | 5,7% | 5,7% | 6,4% | 6,1% |
| 62. Computer software development, consulting services in this area and other related services | 3,9% | 7,7% | 7,4% | 8,1% | 7,9% | 8,4% |
| 63. Activities in the field of information technology | 4,4% | 7,6% | 7% | 7,1% | 7% | 7,7% |
| 64. Activities for the provision of financial services, except for insurance and pension services | 2,3% | 9,4% | 8,6% | 9,5% | 10,7% | 11,1% |
| 65. Insurance, reinsurance, activities of non-state pension funds, except for mandatory social security | 6,5% | 14% | 9,5% | 8,6% | 10,6% | 7,3% |
| 66. Support activities in the field of financial services and insurance | 0,4% | 7,9% | 7,9% | 9,1% | 9,1% | 10,9% |
| 68. Real estate transactions | 5,9% | 11,3% | 11,4% | 11,4% | 11,1% | 11,4% |
| 69. Activities in the field of law and accounting | 3% | 10,4% | 10,4% | 11,1% | 11% | 11,5% |
| 70. Activities of head offices; management consulting | 4,2% | 8% | 7,7% | 8,1% | 8,6% | 8% |
| 71. Activities in the field of architecture and engineering design; technical testing, research and analysis | 4,2% | 7% | 6,7% | 6,9% | 7,1% | 8,2% |
| 72. Research and development | 5,1% | 6% | 6,1% | 6,5% | 6,6% | 7,2% |
| 73. Advertising activities and market research | 4,5% | 5,1% | 4,5% | 4,4% | 4,6% | 4,8% |
| 74. Other professional scientific and technical activities | 3,5% | 6,7% | 6,8% | 7,2% | 7,4% | 8% |
| 75. Veterinary activities | 8,4% | 7,4% | 6,3% | 7% | 7,4% | 7% |
| 77. Renting and leasing | 7,5% | 8% | 6,4% | 6% | 6% | 6% |
| 78. Employment and personnel selection activities | 2% | 4% | 2,9% | 2,9% | 3% | 3,6% |
| 79. Activities of travel agencies and other organizations providing services in the field of tourism | 4,7% | 8,4% | 7,9% | 8% | 8,8% | 10% |
| 80. Security and Investigation Activities | 3% | 7,5% | 7,2% | 7,5% | 7,5% | 7,8% |
| 81. Activities for maintenance of buildings and territories | 2% | 5,1% | 5% | 5,1% | 4,9% | 5,1% |
| 82. Administrative and economic activities, support activities to ensure the functioning of the organization, activities to provide other support services for business | 3,4% | 6,5% | 5,9% | 6,2% | 5,9% | 6,6% |
| 84. Activities of government bodies to ensure military security and compulsory social security | 3,4% | 7% | 8% | 6,7% | 7,2% | 9,5% |
| 85. Education | 3,5% | 7,1% | 6,9% | 6,9% | 6,9% | 6,4% |
| 86. Health activities | 2,8% | 8,3% | 7,7% | 7,8% | 8,1% | 8,6% |
| 87. Residential care activities | 0,2% | 6,5% | 4,6% | 4,3% | 8,6% | 7% |
| 88. Providing social services without providing accommodation | 3,3% | 7,3% | 7,3% | 5,7% | 6,7% | 7,5% |
| 90. Creative activities, activities in the field of art and entertainment | 0,8% | 5,7% | 5,3% | 5,3% | 6,1% | 7,1% |
| 91. Activities of libraries, archives, museums and other cultural facilities | 3,9% | 7,2% | 6,1% | 5,6% | 7,3% | 7% |
| 92. Activities for organizing and conducting gambling and betting, organizing and conducting lotteries | 1,3% | 4,9% | 4,1% | 4,3% | 6,4% | 6,7% |
| 93. Activities in the field of sports, recreation and entertainment | 1,4% | 7% | 6,5% | 6,6% | 6,9% | 7,1% |
| 94. Activities of public organizations | 2,5% | 8,2% | 7,8% | 7,9% | 8,2% | 9,7% |
| 95. Repair of computers, personal and household items | 2,7% | 6,3% | 6,4% | 6,9% | 7,1% | 6,8% |
| 96. Activities related to the provision of other personal services | 1,5% | 6,2% | 6,1% | 6,5% | 6,6% | 6,7% |