The Federal Tax Service of the Russian Federation annually determines the level of profitability for various types of economic activity, that is, by industry. This is done partly in order to determine the indicator for selecting objects and enterprises that will subsequently be subject to tax audit. Partly in order to have an idea of which sectors are the most promising and should invest certain budget funds or attract investors.
In fact, profitability is an indicator of the financial profitability of various transactions and projects, determined by the ratio to revenue or cost.
Profitability by industry in Russia
Average profitability
Data on average profitability from 1995 to 2021 look like this (generated on the basis of financial statements, arithmetic average for all enterprises, small businesses excluded):
| Return on assets, % | Profitability of goods, products, works, services sold, % | |
| 1995 | 5.3 | 15.8 |
| 1996 | 1.3 | 4.8 |
| 1997 | 1.7 | 6.3 |
| 1998 | -0.9 | 8.1 |
| 1999 | 5.0 | 18.5 |
| 2000 | 7.6 | 18.9 |
| 2001 | 6.1 | 14.4 |
| 2002 | 4.3 | 10.9 |
| 2003 | 5.9 | 10.2 |
| 2004 | 8.5 | 13.2 |
| 2005 | 8.8 | 13.5 |
| 2006 | 12.2 | 13.2 |
| 2007 | 10.4 | 13.1 |
| 2008 | 5.4 | 13.0 |
| 2009 | 5.5 | 10.8 |
| 2010 | 6.7 | 10.0 |
| 2011 | 6.5 | 9.6 |
| 2012 | 6.1 | 8.6 |
| 2013 | 4.5 | 7.0 |
| 2014 | 2.5 | 7.3 |
| 2015 | 3.7 | 8.1 |
| 2016 | 5.9 | 7.6 |
| 2017 | 3.8 | 6.7 |
| 2018 | 4.7 | 10.7 |
| 2019 | 6.8 | 11.4 |
Data on the chart (red – assets, green – sales):
There is nothing unusual in such a distribution - sales, as current assets, should have greater profitability. But we note that these statistics are not very useful for a specific legal entity - the averaging method turns the average profitability into a “hospital temperature.”
Profitability by year
List of profitability percentages by year and industry:
| 2018 | 2019 | |
| Total | 10,7 | 10,8 |
| Housekeeping | 17,8 | 17,2 |
| Mining | 31,4 | 28,0 |
| Manufacturing | 12,0 | 11,5 |
| Printing | 12,3 | 11,8 |
| production… | ||
| ... coke and petroleum products | 8,8 | 9,7 |
| ...chemical | 25,2 | 22,1 |
| ...medicines | 21,6 | 26,6 |
| ... plastic or rubber products | 7,4 | 8,0 |
| ...non-metallic mineral products | 11,1 | 10,5 |
| ... metallurgical | 25,8 | 21,6 |
| ... computers | 12,0 | 13,3 |
| ... electrical equipment | 8,2 | 7,7 |
| ... automated technology | 3,2 | 6,1 |
| ... cars | 2,3 | 1,9 |
| ... other vehicles | 10,9 | 8,8 |
| ...furniture | 4,9 | 4,6 |
| Electricity, gas, steam, air conditioning | 8,5 | 8,9 |
| Construction | 3,9 | 4,5 |
| Trade | 5,1 | 5,2 |
| Transportation and storage | 8,4 | 7,8 |
| Mail, couriers | 3,0 | 2,0 |
| Hotels, catering | 5,4 | 2,7 |
| Information and communication | 11,7 | 11,9 |
| Finance and insurance | 17,7 | 34,0 |
| Real estate transactions | 18,0 | 18,1 |
| Scientific activity | 12,5 | 13,2 |
| Administrative activities | 15,7 | 40,7 |
| Education | 2,8 | 3,3 |
| Healthcare, social services | 7,0 | 7,4 |
| Sports, recreation, entertainment | -13,2 | -6,1 |
Interestingly, back in 2018-2019, sports, recreation and entertainment showed negative profitability. Most likely, in 2021 the rating of this industry has gone into deep minus.
Profitability by city
Alas, neither Rosstat nor the Federal Statistics service collect data on cities/regions.
Official figures
It is necessary to consider official indicators taking into account industry, regional and time factors.
Revenue and EBITda margin (earnings before interest and taxes), which actually reflects the amount of profit from sales before interest and taxes in each ruble, varied as follows from 2012 to 2015:
- 2012 – 1.8 billion rubles. industry average.
- In 2013 – 4.8 billion.
- In 2014 – 4 billion.
- And in 2015 about 8 billion.
By industry
Considering the level of profitability in various industries and activities in Russia, in accordance with the data sources used by Rosstat, here are the parameters and ratios that were demonstrated for 2015-2016:
- Communications and other services showed a negative trend of approximately -8%.
- Governance and state security were also in the red with Fr.
- Financial activities showed an insignificant increase of 0.2%.
- Hotels and restaurants increased the figure by 1.7%.
- Construction is about 3% in the black.
- Education is about 4% in positive dynamics.
- Wholesale and retail trade is just over +6%.
- Health care, pharmaceuticals and social services grew slightly more than 7%.
- Electricity and supply, as well as gas by 8%.
- Positive dynamics were also noted in the real estate and rental markets. Here the figure was more than 10%.
- Transport and communications were also in positive territory with a mark of 10.9%.
- Positive growth was also demonstrated by manufacturing industries – an increase of up to 11%.
- Oddly enough, agriculture and forestry showed a positive trend of 19%.
- Mining showed a profitability of 20%.
- But fishing and fish farming are in the black by almost 80%.
By region
As for regional indicators, here is what the statistics look like:
- Yakutia is in the black by 46.08%.
- Chukotka Autonomous Okrug, Murmansk Region, Kalmykia and Sakhalin are increasing production costs in the range from 30% to 40%.
- Nenets Autonomous Okrug, Krasnoyarsk Territory, Tyva, Kamchatka Territory, Magadan Region, Yamalo-Nenets Autonomous Okrug, Irkutsk Region - more than 20%
- Orenburg, Tyumen, Vologda, Kursk, Leningrad, Lipetsk, Belgorod, Chelyabinsk, Amur, Novgorod, Samara, Tula, Kemerovo, Arkhangelsk, Ryazan, Orel, Vladimir, Sverdlovsk regions, Khanty-Mansi Autonomous Okrug, Perm Territory, Buryatia, Karelia, Udmurtia , Tatarstan, Trans-Baikal Territory, Khakassia, Primorsky Territory - in the range from 10% to 20%.
- Tambov, Omsk, Krasnodar Territory, Bashkortostan, Bryansk - from 9% to 10%
- Bryansk, Kostroma, Komi Republic, Yaroslavl, Stavropol Territories - average profitability at 9%.
- Khabarovsk Territory, Chuvashia, Astrakhan, Tomsk regions - 8%.
- Sevastopol, Saratov, Penza, Voronezh, Kaliningrad, Volgograd, Rostov regions and Mari El - 7%.
- Altai Territory, Kirov, Nizhny Novgorod, Moscow, Kurgan regions and Karachay-Cherkessia - 6%.
- Smolensk, Novosibirsk, Ulyanovsk regions, as well as Adygea, Mordovia and St. Petersburg - 5%.
- Moscow and Pskov regions – 4%.
- Tver, Ivanovo, Kaluga regions - 3%.
- North Ossetia, Crimea, Kabardino-Balkaria – 2%.
- Dagestan and the Altai Republic were in the red with an average of -0.3%.
- Even lower figures are in Chechnya, Ingushetia and the Jewish Autonomous Region, where negative balances range from -5 to almost -9%.
On years
Assessing the dynamics of the financial results of the entire set of organizations that operated on the territory of the Russian Federation in a certain period of time, here are some general indicators that can be cited:
- In 1995, the share of profitable organizations was 65.8%.
- In 2000 – 60.2%.
- In 2005 – 63.6%.
- In 2010 – 70.1%.
- In 2015 – 67.4%.
- In 2021 – 70.5%.
- 2017 showed a mark of 68.1%.
- 2018 increased the figure to 72.6%.
If we consider the balance of profits and losses of an organization without small businesses in the Russian Federation, then here are the indicators by type in billions of rubles given by the Federal Statistics Service:
- 2005 – 1350 rub.
- 2006 – 1420 rub.
- 2007 – 1750 rub.
- 2008 – 620 rub.
- 2009 – 1600 rub.
- 2010 – 1800 rub.
- 2012 – 1900 rub.
- 2014 about 2200 rub.
- 2016 about 5500 rub.
- 2017 about 6000 rub.
- 2018 about 13,500 rub.
Norms
From the perspective of the enterprise’s functioning, a level of profitability that takes into account:
- The total burden of income taxes.
- VAT accounting.
Thus, for the manufacturing sector, 3% is considered low. For trade enterprises, the unsatisfactory level is 1%.
New indicators of profitability and tax burden from the Federal Tax Service
From the perspective of the enterprise’s functioning, a level of profitability that takes into account:
- The total burden of income taxes.
- VAT accounting.
Thus, for the manufacturing sector, 3% is considered low. For trade enterprises, the unsatisfactory level is 1%.
The Federal Tax Service (FTS), when selecting objects for inspection, is guided by the following:
- Identifies a number of enterprises whose profitability stands out sharply from the industry average.
- Naturally, those private and public enterprises that demonstrate a lower level are more interested, since, most likely, they are trying to hide a certain amount of earned money in order to pay less taxes.
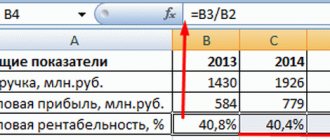
There is a profitability ratio - it shows how efficiently resources are used. This ratio is the ratio of profit to the resources that were invested to obtain it. The coefficient can be expressed in a specific amount of profit received per unit of invested resource, or it can be expressed as a percentage.
For example, a company produces sour cream. 1 liter of milk costs 5 rubles, and 1 liter of sour cream costs 80 rubles. From 10 liters of milk you get 1 liter of sour cream. From 1 liter of milk you can make 100 milliliters of sour cream, which will cost 8 rubles. Accordingly, the profit from 1 liter of milk is 3 rubles (8 R - 5 R).
To calculate the profitability of the “Milk” resource, divide the profit by the cost of the resource: 3 / 5 = 0.6, or 60%.
And another company produces ice cream. 1 kilogram of ice cream costs 200 rubles. To produce it you need 20 liters of milk at the same price - 5 rubles per liter. From 1 liter of milk you will get 50 grams of ice cream, which will cost 10 rubles. Profit from 1 liter of milk is 5 rubles (10 R - 5 R).
Profitability of the resource “Milk” in the production of ice cream: 5 / 5 = 1, or 100%.
Conclusion: the return on resources in the production of ice cream is higher than in the production of sour cream - 100% > 60%.
The profitability ratio can also be expressed in the amount of resources expended that were needed to obtain a fixed amount of profit. For example, to get 1 ruble of profit in the case of sour cream, you need to spend 330 milliliters of milk. And in the case of ice cream - 200 milliliters.
The profitability threshold is the minimum profit that covers the costs. For example, investments, if we are talking about investments, or cost, if we are talking about production. When talking about the profitability threshold, the term “break-even point” is most often used.
Return on assets (ROA)
The ROA indicator is calculated to understand how effectively the company's assets are used - buildings, equipment, raw materials, money - and how much profit they ultimately bring. If the return on assets is below zero, then the company is operating at a loss. The higher the ROA, the more efficiently the organization uses its resources.
How to calculate return on assets. This is the ratio of net profit for a certain period to the value of assets.
ROA = P / TA × 100%,
Where:
P - profit for the period of work;
CA is the average price of assets that were on the balance sheet at the same time.
Return on sales shows the share of net profit in the total revenue of the enterprise. When calculating the ratio, instead of net profit, gross profit or profit before taxes and interest on loans can also be used. Such indicators will be called accordingly - the gross profitability of sales ratio and the operating profitability ratio.
How to calculate return on sales. ROS is calculated as the ratio of profit to revenue.
ROS = P/V × 100%,
Where:
P - profit;
B is revenue.
Information from the Federal Tax Service of the Russian Federation dated 06/05/2020
Fixed production assets are assets that an organization uses to produce goods or services and which are not consumed, but only worn out. For example, buildings, equipment, electrical networks, automobiles, etc. ROFA shows the profitability of the fixed assets that are involved in the production of a product or service.
How to calculate the profitability of fixed assets. This is the ratio of net profit to the cost of fixed assets.
ROFA = P / Cs × 100%,
Where:
P is the organization’s net profit for the required period;
Cs is the cost of the company's fixed assets.
Current assets are resources that are used by a company to produce goods and services, but which, unlike fixed assets, are completely consumed. Current assets include, for example, money in the accounts of an enterprise, raw materials, finished products in a warehouse, etc. RCA shows the effectiveness of managing current assets.
How to calculate the return on current assets. This is the ratio of net profit to working capital.
RCA = P / Tso × 100%,
Where:
P - net profit for a certain period;
Tso is the value of current assets that were used to produce a product or service during the same time.
ROE shows how well the money invested in the company is performing. Moreover, investments are only authorized or share capital. To calculate the efficiency of using not only own but also borrowed funds, the return on capital employed indicator (ROCE) is used. It makes it clear how much income the company generates. Return on equity is compared not only with similar indicators of other companies, but also with other types of investments. For example, with interest on bank deposits, to understand whether it makes sense to invest in a business.
The return on investment indicator is an analogue of return on capital, but it is calculated for any type of investment. For example, bank deposits, stock exchange instruments, etc. ROI shows the return on investment.
How to calculate ROI. ROI is the ratio of the income from an investment to its cost.
ROI = P / Qi × 100%,
Where:
P - profit;
Qi is the price of investment.
Profitability is considered a relative indicator of economic efficiency. It shows the level of efficiency of all types of company resources and natural resources.
The profitability ratio is the ratio of profit to the totality of resources associated with it. Expressed in profit per unit of funds invested in production. Sometimes the indicator is determined in %.
Where were the most active businesses opened in 2021 and in what area?
The profit of small enterprises averaged 998,000 rubles in 2018 and 1,791,000 rubles in 2019. The indicator, according to the bank’s forecasts, will not exceed the level of 2019.
According to experts, the share of small and medium-sized businesses in the Russian economy is around 20-30%, while in developed world economies this figure is more than 60%.
In connection with the pandemic, small and medium-sized businesses in the Russian Federation will receive additional support. Tax holidays for individual entrepreneurs, small and medium-sized businesses from the most affected industries have been extended by three months - until the end of this year. Also, from January 2021, under the program to support SMEs, it is planned to reduce the loan rate for small businesses to 7% from the current 8.5%.
New values
In May 2021, the Federal Tax Service of Russia updated indicators for self-assessment of tax risks. They include 2 groups of indicators:
- list of the industry average tax burden for 2018;
- list of industry average indicators of profitability of activities (goods sold, products, works, services and assets) for 2021.
Let us note that the Federal Tax Service updates the criteria for assessing tax risks annually in accordance with its basic order dated May 30, 2007 No. MM-3-06/333, which approved the Concept of the planning system for on-site tax audits (hereinafter referred to as the Concept).
The bottom line is that industry averages for 2021 allow taxpayers in 2021 (and until more current values are approved):
- compare the indicators of your financial and economic activities with publicly available risk criteria;
- voluntarily clarify tax obligations to the budget, which reduces the risk of assigning an on-site audit.
Also see “Grounds for an on-site tax audit.”
REFERENCE
In recent years, the Federal Tax Service has changed its approach to tax control: the emphasis is on a comprehensive analysis of the financial and economic activities of the taxpayer, and, as a result, the abandonment of total control and the transition to control based on risk criteria.
According to the Concept, planning on-site audits is an open process based on the selection of taxpayers for control based on publicly available criteria for assessing the risk of a tax audit.
WARNING
A taxpayer who meets these criteria most likely be included in the on-site tax audit plan.
Dynamics and coefficients
As for the dynamics, today in Russia it is below average. This may be due to insufficient adoption of technological innovations, improved methods and entry into larger markets.
Here a kind of vicious circle arises when the insufficient quality of the products produced due to the small number of technological improvements creates a low attractiveness of the product. Thus, we can conclude that in order to increase the level of profitability of both a specific enterprise and the industry as a whole, a set of measures aimed at comprehensive improvement is necessary.
