Financial control is a factor that influences increasing the efficiency of a company. The forecast balance is one of the tools for this financial control. This is a special document, the form of which is established by Order of the Ministry of Finance No. 66n. The organization can also develop a sample balance sheet itself. In this case, enlarged lines can be used. Based on the values of these lines, the coefficients are determined. They are needed to evaluate the results achieved by the organization.
How is the consolidated forecast balance ?
Features of the projected balance
The forecast balance is a planning tool. It is a type of financial reporting through which you can extract information about the projected state of the company at the end of the reporting period.
How is the balance sheet of a commercial organization forecasted using the percentage of sales method?
To draw up a balance sheet, you need to collect information about the financial performance of the company accumulated over a certain period. Forming a balance involves the following preparation:
- Analysis of the economic condition of the company.
- Determining the required coefficients.
- Establishing the relationship between different meanings.
How is forecast financial information verified ?
The accountant will need to take into account the likelihood of a particular balance sheet item remaining unchanged. At the same time, it makes sense to determine which factors will change balance sheet items.
Balance functions
One of the key functions of the balance sheet is to identify problems that may arise during further activities. Let's look at the remaining functions:
- Calculation of key financial indicators.
- Adequate assessment of the financial condition of the company in the future.
- Detection of factors that could presumably worsen the financial condition of the subject.
- Identification of factors that may affect economic sustainability.
- Establishing the accuracy of the calculations made.
- Assessing the compliance of coefficients with market norms.
- Assessment of the company's business prospects.
- Estimation of the size of the organization's obligations that will appear in the future.
- Setting short-term and long-term goals regarding profit margins, current assets, and debts of the organization.
A forecast balance sheet is a must for large enterprises that plan to develop.
The procedure for drawing up a forecast balance
Let's study in accordance with what algorithm the document in question can be generated. Drawing up a forecast balance, if you follow the common scheme, involves:
- Conducting an analysis of current financial indicators within the framework of the company's economic activities.
- Study of financial results based on the results of certain reporting periods, as well as identification of factors that may influence them.
- Determination of changes in the assets, liabilities of the enterprise, its income and expenses, in accordance with various reporting periods.
- Formation of forecast indicators and their subsequent documentation.
Features of compilation
The first step in creating a balance sheet is to establish the desired amount of capital for the company. At the same time, you need to be aware that these types of capital will not change significantly:
- Statutory.
- Spare.
- Additional.
That is, such a basic indicator as the company's capital changes under the influence of changes in profit. Profit is the most dynamic indicator. It is calculated by multiplying estimated revenue by profitability indicators for previous periods.
If the future amount of income is known, you can use the percentage of sales method. Under this method, balance sheet items increase/decrease in proportion to changes in revenue.
An increase in income implies an increase in the value of an organization's inventory. At the same time, there will be transactions with new partners. Accordingly, the volume of receivables will increase. It is assumed that in order to purchase the necessary assets, new loans will need to be issued. They can be both long-term and short-term.
After determining the values of the key lines, you need to calculate assets and liabilities. By subtracting a liability from an asset, you can determine the company's need to attract external sources of financing.
Forecast balance block
The forecast balance in the Excel financial model is built automatically based on the data that was previously entered into the model. Accordingly, you do not need to enter any data in this block. In this instruction, I will go into detail on each line of the balance sheet, and explain what Assets and Liabilities .
To start working on the forecast balance, you need to open block “13. Balance" on the "Input data" sheet :
Then you will go to the summary balance sheet of your financial model:
The expanded forecast balance is reflected on the sheet “11.3.Balance” (for the corresponding option):
Using this example, we will look at how the balance sheet is built in a financial model.
Assets consist of Current assets and Long-term assets:
1.1. Current assets include the following lines:
— Cash is the cash balance that was formed on sheet “11.2.CF (B-1)”
Here's my example:
— Inventories - this line is intended to reflect warehouse inventories, but in order to simplify work with this financial model, if necessary, inventories of materials are reflected in monetary terms in the “Operating expenses” block.
- Accounts receivable - in simple terms - are funds that are owed to us. This includes: Receivables from the sale of goods or services in installments + VAT refund (if any) + Prepayment for raw materials included in operating expenses
Here's my example:
— Other short-term assets - this line is not included in this financial model. If necessary, you can fill it out yourself if your project requires it.
1.2. Long-term assets
— Fixed assets – this line is calculated using the formula: Fixed assets for the previous month + Investment cash flow – Depreciation.
Here's my example:
I’ll show you using February as an example.
To the figure for January we add the investment cash flow for February.
Minus depreciation for February (in my case, depreciation in February is not yet accrued).
— Other long-term assets - this line is not included in this financial model.
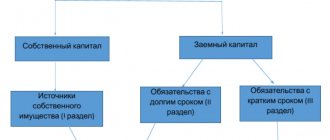
Liabilities consist of Short-term liabilities, Long-term liabilities and Capital:
2.1. Short-term liabilities
— Short-term accounts payable - this line includes Accrued wages (including accruals) for the current month + Liabilities to pay income tax and VAT (only for VAT payers) + Accrued dividends + Accounts payable for payments for operating expenses
My example:
— Other short-term liabilities - this line is not involved in constructing the balance sheet in this financial model.
2.2. long term duties
— Liabilities for credits and loans are the Balance of debt on the loan + Balance of debt on other loans (there are no other loans in my project)
My example:
— Other short-term liabilities - this line is not used in the model.
Compilation
The formation of a forecast balance can be divided into these steps:
- Analysis of the current economic situation (analytical tables are used).
- Analysis of activity results.
- Establishing factors that influence financial results.
- Establishing relative and absolute adjustments in assets-liabilities, income-expenses.
- Directly creating balance.
The first step in creating a balance sheet is to establish the size of the firm's capital. This value can be determined using the formula SKn + 1. The authorized capital is considered a practically unchangeable value. Therefore, it is entered into the forecast balance in the same value as indicated in the reporting balance. Additional and reserve capital remain virtually unchanged. That is, the key element is the profit of the organization.
The amount of profit is set based on the expected percentage of profitability. It is determined on the basis of indicators of the dynamics of the ratio of profit to revenue.
The revenue forecast is made based on these values:
- Sales volume for past periods.
- Market conditions.
- Dynamics of changes in market conditions.
- Profitability of activities.
- Price policy.
- Expenses.
- Current production capacity.
The forecast balance is needed to determine the coefficients that help compare the actual results of activities with the planned ones.
FOR YOUR INFORMATION! When developing a forecast balance, computer programs are usually used.
Percentage of sales method
There are many methods for developing a forecast balance. The most popular of them is to create a balance based on the dependence of all parameters on sales volume. The essence of this method is that most parameters increase/decrease depending on changes in sales volume. When forming a balance using this method, you need to take these rules into account:
- An increase in sales is accompanied by an increase in the value of assets.
- The financing gap is compensated by external sources of financing (for example, loans, credits).
- An increase in the value of assets can be achieved by increasing the company's liabilities and retained earnings.
- To draw up a balance sheet, it is necessary to constantly collect information about the organization’s activities.
- The work is predicted based on a detailed analysis of the maximum number of parameters: income, expenses, assets and liabilities. That is, analysis is impossible without the maximum amount of information.
- Drawing up a balance sheet involves the use of various accounting reports. It is advisable to take reports for the longest periods possible.
- It is easiest to make predictions about the parameters of operations that are constantly repeated.
Forming a forecast balance using the percentage of sales method involves these steps:
- Establishing the projected sales volume of goods.
- Establishing the percentage increase/decrease in actual revenue in comparison with planned values.
- Preparation of a forecast report on the financial results of activities. Costs and commercial expenses are determined in relation to the amount of goods sold. The final result of generating the report is the calculation of the net profit indicator.
- Formation of a forecast balance.
- Summarizing the values of reporting items to establish the final amount for assets/liabilities.
The very last stage of forming a balance is to establish the need for third-party sources of financing. This need is determined by obtaining the difference between assets and liabilities. The resulting value is needed to adjust balances and generate balance sheet differences.
FOR YOUR INFORMATION! The forecast balance is a universal document. On its basis, you can determine key financial ratios. For example, these could be liquidity and economic stability ratios. Based on the balance, various target values can be calculated. It is necessary to determine the development strategy of the organization.
Projected balance sheet of an enterprise: calculation example
Although the future is unknown, a careful analysis can provide insight into how the company may evolve. Forecast balance sheet methods usually involve a step-by-step process. The forecasting process can be broken down into six steps:
Table 1. Forecast of MDD
Use cash and/or debt accounts to balance.
| Cash Flow Forecast (CFF) | ||||
| Indicators | Budget period | |||
| 1 | 2 | 3 | 4 | |
| Balance at start | 10 000 | 10 500 | 7 481 | 7 597 |
| Cash receipts from core activities | ||||
| Revenues from sales | 54 300 | 57 120 | 66 080 | 64 960 |
| Advances received | – | – | – | – |
| Total receipts | 54 300 | 57 120 | 66 080 | 64 960 |
| Cash payments from operating activities | ||||
| Direct materials | 2 370 | 4 509 | 4 866 | 5 164 |
| Direct labor | 20 000 | 17 250 | 23 000 | 20 250 |
| General production expenses | 14 000 | 12 900 | 15 200 | 14 100 |
| Business expenses | 8 300 | 7 900 | 8 700 | 8 300 |
| Administrative expenses | 5 130 | 4 850 | 6 050 | 4 850 |
| Income tax | 4 000 | |||
| Total payments | 53 800 | 47 409 | 57 816 | 52 664 |
| NPV from core activities | 500 | 9 711 | 8 264 | 12 296 |
| Cash flows from investing activities | ||||
| Purchase of fixed assets | – | 24 300 | – | – |
| Long-term financial attachments | – | – | – | – |
| Sales of fixed assets | – | – | – | – |
| Implementation of financial investments | – | – | – | – |
| NPV from investment activities | – | -24 300 | – | – |
| Cash flows from financing activities | ||||
| Getting loans | – | 11 570 | 4 000 | – |
| Loan repayment | – | – | 11 570 | 4 000 |
| Loan interest payments | – | – | 579 | 200 |
| NPV for financial activities | – | 11 570 | – 8 149 | – 4 200 |
| Balance at the end | 10 500 | 7 481 | 7 597 | 15 693 |