Why do you need to analyze the share of deductions?
A significant proportion of tax deductions in the declaration will attract the attention of tax authorities. Because of this, they may even schedule an on-site inspection, and be sure to ask for clarification. The safe percentage of VAT deductions at the federal level is 89%. It was approved by order of the Federal Tax Service dated May 30, 2007 No. MM-3-06 / [email protected] along with other criteria, upon “achieving” which the company comes under the radar of the tax inspectorate.
Read in the berator “Practical Encyclopedia of an Accountant”
Tax audit risk criteria
How to calculate the tax burden of an enterprise
New types of payments have appeared, such as trade tax, resort tax, and today both the tax authority and banks are involved in checking the tax burden.
The concept of tax burden is absent in tax legislation. The tax burden is very similar to the tax burden, which is:
- relative value (degree of diversion of funds to pay taxes);
- absolute value (burden arising from the obligation to pay taxes).
It is also possible to determine the tax burden as a share of the amount of taxes paid for a certain period in some economic base for the same period, which allows us to assess the impact of the size of tax payments on the profitability and profitability of the entity. Simply put, the tax burden is the ratio of the amount of taxes paid and the company’s revenue. Please note that the tax burden is established:
- tax authority;
- Central Bank.
If the amount of taxes and contributions is 0.9% of the debit turnover on the account, then the company is at risk; Companies whose taxes are slightly different from their debit turnover will also be at risk. The tax authority monitors the tax burden as part of the audit of tax returns. The tax burden can be calculated at different economic levels:
- for the state as a whole or for its regions;
- by economic sectors of the country or regions;
- by group of similar enterprises;
- for individual economic entities;
- for a specific person.
As a calculated indicator, the tax burden echoes the concept of the effective tax rate, which is the percentage of actually accrued tax in the tax base for this tax. In letters No. AS-4-2/12722 and No. ED-4-15/ [email protected] this concept is defined as the tax burden for the corresponding tax.
The basis for calculating the tax burden can be (depending on the economic level and the purposes of the calculation):
- planned profit or expected income;
- newly created value;
- source of tax payment (expenses or profit);
- income;
- revenue (with and without VAT).
In 2021, companies and entrepreneurs spent approximately 11% of their revenue on paying taxes. However, the tax burden is different in different industries:
- in agriculture – 4%;
- in trade – 4%;
- in the information and communications sector – 16%;
- in the production of beverages and tobacco products – 30%.
To understand what tax burden a company should have, you need to look into the concept of on-site tax audits.
Permissible level of tax burden in 2021 and 2021
The permissible level of tax burden is based on the previous year's figures. This, in particular, is stated in the letter of the Federal Tax Service dated August 22, 2021 No. GD-3-1 / [email protected] .
In accordance with the order of the Federal Tax Service of Russia dated May 30, 2007 No. MM-3-06/ [email protected] , the tax burden is calculated as the ratio of the amount of taxes paid according to statistical tax reporting and the turnover (revenue) of organizations according to the Federal State Statistics Service. The tax burden was calculated taking into account personal income tax revenues.
In relation to the data published for 2021, the fiscal tax burden on insurance premiums was calculated for reference - as the ratio of the amount of insurance premiums paid for compulsory social insurance and the turnover (revenue) of organizations, which is not included in the above tax burden indicator.
When comparing the tax burden of the type of economic activity “activities of sanatorium and resort organizations - 86.90.4,” one should take into account the level of tax burden in Russia, due to the lack of values for similar industries. Thus, the level of tax burden in the Russian Federation for 2021 was 10.8%.
In 2021, the tax burden for VAT will change. This is due to an increase in the amount of tax paid to 20%. An increase in the VAT rate, while the cost of purchase and sale remains unchanged, leads to a decrease in net profit and an increase in the tax burden. And if in the Concept of on-site tax audits the deduction rate was 89%, then with an increase in taxes it will clearly change. Let us remind you that the indicators of VAT deductions by region in 2021 differed.
Since the tax authority pays special attention to VAT deductions, if the share does not correspond, it is better to immediately prepare an explanatory note.
In conclusion, it should be noted that the tax burden will only increase, which is associated with an increase in VAT, as well as the introduction of non-tax payments. But at the same time, the net profit and income of companies will fall, which must be taken into account in tax planning for 2019.
| The tax burden | ||
| Type of economic activity (according to OKVED-2) | 2017 | |
| The tax burden, % | Reference-fiscal burden for SV, % | |
| TOTAL | 10,8 | 3,6 |
| Agriculture, forestry, hunting, fishing, fish farming | 4,3 | 5,5 |
| Crop and livestock farming, hunting and provision of related services in these areas | 3,5 | 5,4 |
| Forestry and logging | 7,5 | 6,8 |
| Fishing, fish farming | 7,9 | 5,5 |
| Mining | 36,7 | 1,8 |
| Extraction of fuel and energy minerals - total | 45,4 | 1,0 |
| Extraction of mineral resources, except fuel and energy | 18,8 | 4,1 |
| Manufacturing industries | 8,2 | 2,2 |
| Production of food products, beverages, tobacco products | 28,2 | 2,4 |
| Production of textiles, clothing | 8,1 | 4,2 |
| Production of leather and leather products | 7,9 | 4,7 |
| Wood processing and production of wood and cork products, except furniture, production of straw products and wicker materials | 2,0 | 3,6 |
| Production of paper and paper products | 4,4 | 1,8 |
| Printing activities and copying of information media | 9,2 | 4,3 |
| Production of coke and petroleum products | 5,1 | 0,2 |
| Production of chemicals and chemical products | 1,9 | 2,4 |
| Production of medicines and materials used for medical purposes | 6,9 | 3,0 |
| Production of rubber and plastic products | 6,3 | 2,6 |
| Production of other non-metallic mineral products | 8,9 | 3,5 |
| Metallurgical and production of finished metal products, except machinery and equipment | 4,4 | 2,4 |
| Production of machinery and equipment, not included in other groups | 8,8 | 3,9 |
| Production of electrical equipment, production of computers, electronic and optical products, production of motor vehicles | 9,9 | 4,3 |
| Production of computers, electronic and optical products | 12,5 | 5,3 |
| Electrical Equipment Manufacturing | 6,7 | 3,0 |
| Manufacture of other vehicles and equipment | 4,7 | 4,8 |
| Production of motor vehicles, trailers and semi-trailers | 5,1 | 1,7 |
| Providing electricity, gas and steam; air conditioning | 6,8 | 2,4 |
| Electricity generation, transmission and distribution | 8,1 | 2,2 |
| Production and distribution of gaseous fuels | 1,3 | 1,4 |
| Production, transmission and distribution of steam and hot water; air conditioning | 6,5 | 4,5 |
| Water supply, sanitation, organization of waste collection and disposal, activities and elimination of pollution | 8,4 | 4,8 |
| Construction | 10,2 | 4,3 |
| Wholesale and retail trade; repair of vehicles and motorcycles | 3,2 | 1,2 |
| Wholesale and retail trade in motor vehicles and motorcycles and their repair | 2,7 | 1,1 |
| Wholesale trade, except wholesale trade of motor vehicles and motorcycles | 3,1 | 0,9 |
| Retail trade, except trade in motor vehicles and motorcycles | 3,6 | 2,2 |
| Activities of hotels and catering establishments | 9,5 | 5,7 |
| Transportation and storage | 6,8 | 4,8 |
| Activities of railway transport: intercity and international passenger and freight transportation | 8,5 | 6,8 |
| Pipeline transport activities | 4,5 | 2,1 |
| Water transport activities | 9,3 | 4,1 |
| Air and space transport activities | neg. | 3,0 |
| Postal and courier activities | 14,4 | 11,6 |
| Activities in the field of information and communications, total | 16,4 | 5,2 |
| Real estate activities | 21,3 | 6,3 |
| Administrative activities and related additional services | 15,4 | 9,2 |
| How to determine the tax burden: calculation formulas | ||
| Tax burden indicator | Calculation formula | Explanations |
| For OSNO (general taxation system) | NNosno = (Nnds + Np): B | NNosno – tax burden according to OSNO; VND – VAT payable, according to the declaration; Np – income tax payable; B – revenue excluding VAT according to the profit and loss statement |
| For Unified Agricultural Tax (Unified Agricultural Tax) | NNeskhn = Neskhn : Deskhn | NNeskhn – tax burden according to the Unified Agricultural Tax; Unskhn – Unified agricultural tax-tax payable; Deskhn - income according to the Unified Agricultural Tax declaration |
| For simplified taxation system (simplified taxation system) | NNusn = Nusn : Dusn | NNusn – tax burden according to the simplified tax system; Nusn – simplified tax system - tax payable; Dusn – income under declaration |
| For an individual entrepreneur | NNNDFL = NNDFL : DNDFL | NNNDFL – tax burden for personal income tax; Personal income tax - personal income tax according to the declaration; Personal income tax - income according to 3-personal income tax |
| According to VAT (option 1) | NNnds = Nnds : NBtotal | NNnds – tax burden for VAT; VND – VAT payable; NBtotal – tax base (sum of tax bases for sections 3 and 4 of the VAT return) |
| According to VAT (option 2) | NNnds = Nnds : NBrf | NNnds – tax burden for VAT; VND – VAT payable; NBRF - tax base for section 3 of the VAT return |
| For income tax | ННп = Нп: (Др + Двн) | NNP – tax burden for income tax; Np – income tax payable; Др – income from sales according to the declaration; Dvn – non-operating income according to the declaration |
| Important! It is necessary to remember the notes to the formulas for individual entrepreneurs, simplified taxation system, OSNO and unified agricultural tax. If the taxpayer also pays other taxes (property, land, water, transport, excise taxes, mineral extraction tax, natural resources, etc.), accruals for such taxes are taken into account in the calculation. Personal income tax does not participate in the formation of a similar result for individual tax regimes. |
| Safe share of VAT deductions in Russian regions (in%, for the 2nd quarter of 2021) | |||
| Region | Share of deductions, % | Region | Share of deductions, % |
| Altai region | 89,6% | Primorsky Krai | 94,8% |
| Amur region | 116,8% | Pskov region | 89% |
| Arhangelsk region | 88,5% | Republic of Adygea | 86,5% |
| Astrakhan region | 58,3% | Altai Republic | 90,4% |
| Belgorod region | 89,4% | Republic of Bashkortostan | 87,7% |
| Bryansk region | 92,3% | The Republic of Buryatia | 85,3% |
| Vladimir region | 84,6% | The Republic of Dagestan | 87,2% |
| Volgograd region | 87% | The Republic of Ingushetia | 94% |
| Vologda Region | 83,8% | Republic of Kalmykia | 78,8% |
| Voronezh region | 92,3% | Republic of Karelia | 84,2% |
| Moscow city | 88% | Komi Republic | 79,3% |
| City of Saint Petersburg | 90,2% | Republic of Crimea | 88,2% |
| City of Sevastopol | 82,4% | Mari El Republic | 90,4% |
| Jewish Autonomous Region | 87% | The Republic of Mordovia | 89,6% |
| Transbaikal region | 90,9% | Republic of North Ossetia–Alania | 88,2% |
| Ivanovo region | 92,6% | Republic of Tatarstan | 88,4% |
| Irkutsk region | 79,3% | Tyva Republic | 74,4% |
| Kabardino-Balkarian Republic | 94% | The Republic of Khakassia | 89,9% |
| Kaliningrad region | 65,8% | The Republic of Sakha (Yakutia) | 85% |
| Kaluga region | 86,6% | Rostov region | 92,1% |
| Kamchatka Krai | 88,9% | Ryazan Oblast | 85,2% |
| Karachay-Cherkess Republic | 93,7% | Samara Region | 84,6% |
| Kemerovo region | 81,7% | Saratov region | 85,5% |
| Kirov region | 84,9% | Sakhalin region | 93,2% |
| Kostroma region | 84,1% | Sverdlovsk region | 86,6% |
| Krasnodar region | 89,5% | Smolensk region | 91,9% |
| Krasnoyarsk region | 76,1% | Stavropol region | 88,9% |
| Kurgan region | 87,5% | Tambov Region | 95,2% |
| Kursk region | 88,3% | Tver region | 88,6% |
| Leningrad region | 86,3% | Tomsk region | 74,3% |
| Lipetsk region | 88,9% | Tula region | 91,6% |
| Magadan Region | 99,9% | Tyumen region | 83,8% |
| Moscow region | 90,6% | Udmurt republic | 80,1% |
| Murmansk region | 78,5% | Ulyanovsk region | 91,1% |
| Nenets Autonomous Okrug | 116% | Khabarovsk region | 88% |
| Nizhny Novgorod Region | 87,4% | Khanty-Mansiysk Autonomous Okrug – Ugra | 61,9% |
| Novgorod region | 87,4% | Chelyabinsk region | 87,5% |
| Novosibirsk region | 89,1% | Chechen Republic | 103,3% |
| Omsk region | 82% | Chuvash Republic | 83,2% |
| Orenburg region | 71,4% | Chukotka Autonomous Okrug | 95,8% |
| Oryol Region | 92,9% | Yamalo-Nenets Autonomous Okrug | 97,6% |
| Penza region | 90,1% | Yaroslavl region | 85,8% |
| Perm region | 79,3% |
Where to find deduction shares by region
In addition to the federal figure for VAT deductions, you need to know the share of VAT deductions at the regional level. This indicator is not published, but it can be calculated based on other publicly available data.
On the official website in the “Statistics and Analytics” section, the Federal Tax Service publishes data on statistical tax reporting forms, including reports on the tax base and the structure of VAT charges.
These are statistical reports in form 1-VAT. This report, generated by region, contains data on the total VAT charges and the total share of deductions for the region you need. The safe share of deductions for a region can be calculated by finding the percentage ratio of the amount of deductions to the amount of accruals.
The Federal Tax Service updates statistical data on its website, so they need to be checked periodically.
The Federal Tax Service website already has data to fill out the declaration for the 1st quarter of 2021.
What affects the size of the VAT tax burden?
Taxpayers are usually interested in tracking their tax burden and maintaining it at an average level - this helps not to attract unnecessary attention from inspectors. You can follow it like this:
- see how your tax burden changes throughout the year and how its relation to the industry average changes;
- timely enter new types of company activities into the Unified State Register of Legal Entities or Unified State Register of Individual Entrepreneurs;
- plan financial flows in advance to avoid sudden changes in the tax burden.
To control the tax burden, you need to understand what it consists of, what increases it and what decreases it.
The increase in the tax base and the amount of tax payable is affected by:
- the amount of proceeds from sales and the tax accrued from the sale of taxable objects;
- advances received from buyers;
- construction and installation operations for own needs.
Reduce tax payable:
- sales transactions that are exempt from VAT are not subject to VAT or are taxed at a rate of 0%;
- advances paid to suppliers;
- imports to the Russian Federation from EAEU member states and other countries;
- buyer advances closed during the period;
- VAT that you paid as a tax agent;
- tax deductions for goods, works and services received from suppliers.
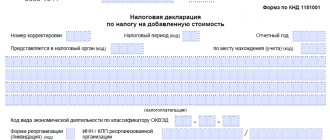
VAT deductions also affect the level of tax burden, and this is also a separate criterion for assessing tax risks. If there are many deductions in the reporting, the tax office may also begin an audit. Deductions are considered significant if their share of the assessed tax is 89% or higher. We have already told you how to calculate the safe share of tax deductions for VAT.
We calculate the share of deductions
In different regions, indicators can be either higher or lower than 89%.
But that is not all. You will need a figure for your company.
To determine the rate of VAT deductions for a company, you need to make calculations based on declarations for the last four quarters. Add up the amount of accrued VAT, add up the amount of deductions, divide the total amount of deductions by the total amount of accrued VAT. This way you will determine the share of deductions in the total amount of calculated VAT for the company for four quarters. It needs to be compared with the federal and regional shares of the deduction.
From 1.3 to 45.4% - the spread of the tax burden by industry
How can you find out what the industry average pays? To do this, you need to focus on the indicators of the tax burden by type of activity for the previous year, which the Federal Tax Service makes publicly available. The difference in industry indicators is impressive: the spread is 44.1%. The tax burden is low for agriculture, energy workers, low for transport workers, average for construction workers and public catering, above average for manufacturers of computers, drinks, tobacco, communications specialists, IT specialists, the highest in the field of mining.
But what about narrow niche areas that do not fall into the general industry list, and for which the average figure has not been determined? That’s when you need to focus on the Russian average tax burden for the previous year. In 2018, when calculating, you need to be equal to the 2021 figure, which was 10.8%. This is exactly what the Federal Tax Service of the Russian Federation indicated in letter dated August 22, 2021 No. GD-3-1/5806.
In the summer of 2021, the Federal Tax Service received a written request on how to calculate the tax burden for an enterprise engaged in health resort activities. The question arose due to the fact that the federal list of average industry indicators does not include the tax burden of this industry. The response letter from the Federal Tax Service states that the tax burden of sanatorium and resort organizations should be compared with the average level of tax burden in the Russian Federation - due to the lack of values for the industry, that is, with an indicator of 10.8%.
Tax burden by industry. Data for 2017.


